April ADP Reports 109k New Private Sector Jobs

- Equity futures are trading higher, and bond yields and oil lower, with word of a possible deal to end the Iran war, but details, as always, are difficult to flesh out but that’s what has markets moving early today. Meanwhile, as we wait for the Friday jobs report we received plenty of April data yesterday and the Cliff Notes version is that both labor market stability and price pressures continued to be experienced during the month. Most of the data hints at a continuation of recent trends: a labor market that is moderating, but stable, and price pressures that will likely get worse before they get better. The latest ADP Employment Report is the headline for today and we review those results below. Currently, the 10yr is yielding 4.35% down 6bps on the day, while the 2yr is yielding 3.87%, down 7bps on the day.
- The April ADP Employment Change Report reported 109 thousand new private sector jobs, exceeding the 61 thousand new jobs in March (revised down from 62 thousand) but trailing the 120 thousand expected. It was the largest monthly gain since January 2025. So, a solid read on private sector hiring in April, and while the relationship between ADP and BLS has been tenuous at best it does add to the sense that the upcoming jobs report, which is expecting 75 thousand private sector jobs and 65 thousand overall, won’t differ too much from the positive early reads on April employment.
- As usual, job gains were strongest in healthcare at 61 thousand while manufacturing stopped a 26th month streak of job losses, eking out 2 thousand new jobs. For the third straight month, the smallest firms (1-19 employees) added the most jobs at 43 thousand while the largest firms (>500 employees) were just behind with 42 thousand and middle size firms (20-499 employees) managed to create 2 thousand jobs. Annual wage growth for Job Stayers was 4.4% vs. 4.5% in March, while annual wage growth for Job Leavers was 6.6%, same as March. Wage gains have been steady since peaking at 8% (job stayers) and 16% (job leavers) in 2022. A year ago, annual wage gains for job stayers were 4.5% and for job leavers 7.0%.
- The ISM Services Index was released yesterday and provided a mixed picture on the services side of the economy. The overall index was 53.6 vs. 54.0 in March and 53.7 expected. That represents decent expansion in the largest sector of the economy, but it is a five-month low. Much like the manufacturing sector, the Prices Paid Index received plenty of scrutiny with the index unchanged at 70.7 coming in lower than the 73.5 expectation. Most comments, however, stated petroleum price pressure had yet to arrive so that could be a coming attraction. Stay tuned! In addition, while the level was unchanged from March it still represents the highest reading for the index since October 2022.
- Meanwhile, New Orders fell from 60.6 to 53.5 vs. 57.3 expected. While still in expansion territory, it’s the second lowest amount this year for new orders. Finally, the Employment Index improved from 45.2 to 48.0, but that keeps employment in contraction territory and speaks to the moderation going on in the labor market. In summary, this report highlights both the stability in the economy and the moderation that has been ongoing in the labor market. The services side remains in expansion territory overall, but employment levels continue contracting, albeit gradually. The prices paid pressure will likely manifest in higher retail-level pricing combined with the higher prices from the manufacturing side. Thus, expect little to no improvement in the inflation outlook for the near future.
- The March Job Opening and Labor Turnover Survey (JOLTS) was released with job openings at 6.866 million vs. 6.922 million the prior month and 6.850 million expected. So, a continued downtrend in openings but nothing dramatic. The job/jobless ratio ticked up to 0.95 from 0.91 and is another signal of the stability in the labor market. The Quits Rate (those leaving voluntarily divided by total employed) rose from 1.9% to 2.0% which indicates modest improvement in worker confidence in finding other employment. However, the Layoff Rate increased from 1.1% to 1.2%, above the 1.1% expectation and tied with the highest level going back to 2023, but to be fair that level has been reached seven times since emerging from the pandemic. Thus, we aren’t concerned with the March uptick but if it moves higher from here that would set a new post-pandemic high and signal additional layoff pressure occurring. That’s something to watch in future releases.
- The March Trade Balance Report was released yesterday and posted a trade deficit of -$60.3 billion vs. -$57.8 billion the prior month and slightly better than the -$61.0 billion expectation. Exports rose 2.0% but imports rose 2.3% generating the additional deficit. The US trade deficit comes generally from the goods side while we export a surplus of services, but the US consumer drives the bus as to goods purchases and that works to keep the trade deficit intact. Prior to the tariff controversy last year, the trade deficit was running in the -$70 billion monthly range. Now that deficit is more down to -$60 billion territory. So, there has been some modest deficit improvement over the past year but considering the uproar over the tariff issue, we were hoping for more.
April ADP Posts Most Private Sector Job Growth Since Jan. 2025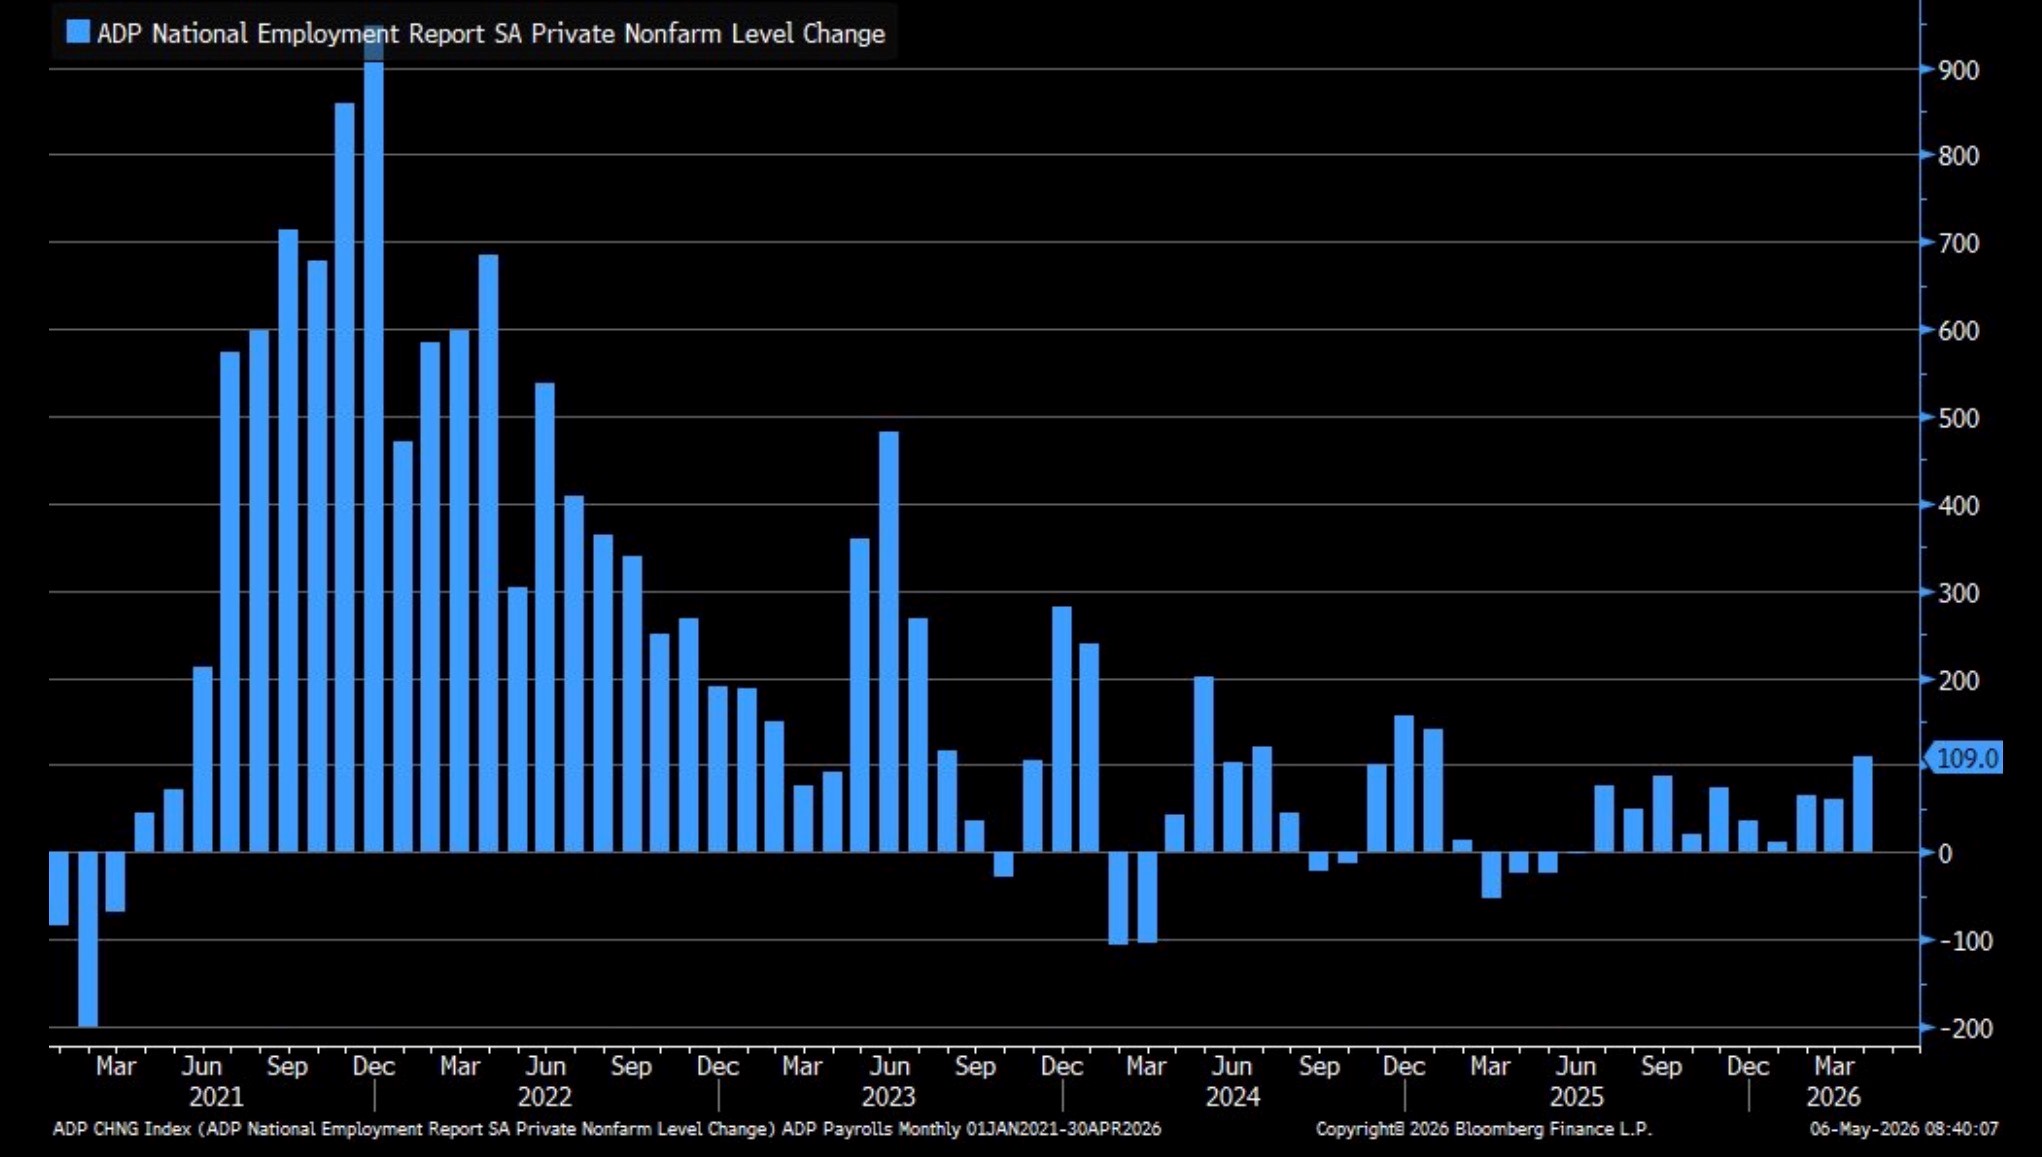
ISM Services – Softening but Still in Expansion (Purple). Prices Paid Matches March High (White)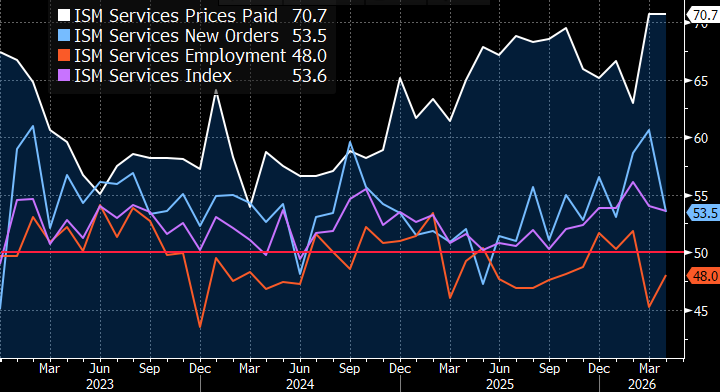
Source: ISM
Job Openings and Labor Turnover Survey – Layoff and Quits Rate Increases Slightly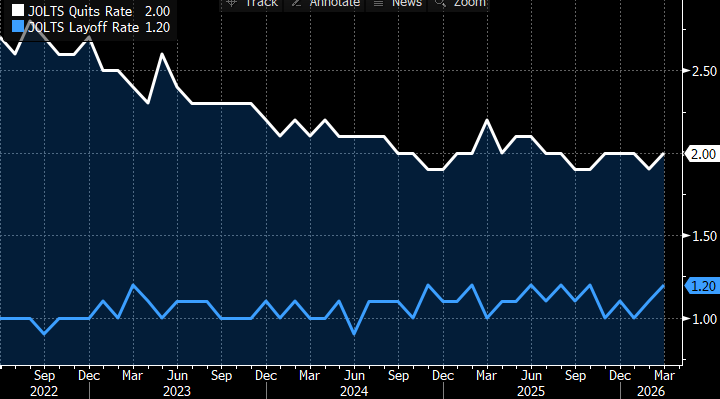
Source: BLS
JOLTS – Job Openings Continue to Gradually Trend LowerSource: US BLS
Securities offered through the SouthState | DuncanWilliams 1) are not FDIC insured, 2) not guaranteed by any bank, and 3) may lose value including a possible loss of principal invested. SouthState | DuncanWilliams does not provide legal or tax advice. Recipients should consult with their own legal or tax professionals prior to making any decision with a legal or tax consequence. The information contained in the summary was obtained from various sources that SouthState | DuncanWilliams believes to be reliable, but we do not guarantee its accuracy or completeness. The information contained in the summary speaks only to the dates shown and is subject to change with notice. This summary is for informational purposes only and is not intended to provide a recommendation with respect to any security. In addition, this summary does not take into account the financial position or investment objectives of any specific investor. This is not an offer to sell or buy any securities product, nor should it be construed as investment advice or investment recommendations.