Bond Portfolio Trends: Fourth Quarter 2025

Examining Bond Portfolio Trends: Fourth Quarter 2025
- Beginning in May 2012, we started tracking portfolio trends of our bond accounting customers here at SouthState Securities. At present, we account for over 130 client portfolios with a combined book value of $11.9 billion (not including SouthState Bank’s portfolio), or $91 million on average per portfolio. Twelve months earlier, the average portfolio size was $106 million, representing a 14% decrease during the year. That decline is modestly larger than recent quarterly results in the 8% to 10% range. Average portfolio size peaked at $111 million in November 2023.
Fourth Quarter Market Observations
- The fourth quarter of 2025 was characterized by a Fed recommitting to rate cuts after pausing for nearly a year. Although inflation concerns from tariffs were still prevalent, most inflation reporting during the year failed to pick up a noticeable increase in prices, although the inflation improvement in 2024 proved fleeting in 2025. To be sure, the movement of yields was constrained by constant tariff policy uncertainty, but the bias was for lower yields as a slowdown in growth became the consensus expectation.
- Also, the rate moves in the fourth quarter were rangebound as the 2yr around 3.50% was already pricing in a trio of 25bps rate cuts that the Fed eventually delivered but rate cut uncertainty for 2026 kept further short-end rallies contained. Longer-term yields generally marked time in the fourth quarter as inflation reporting was sparse due to the government shutdown, and economic growth continued to surprise to the upside as the consumer refused to fold.
- During the quarter, the 10yr Treasury yield ended 2bps higher reflecting the stalemate between slower growth expectations, a resumption of rate cuts, and little improvement in inflation. Meanwhile, the 2yr Treasury finished the quarter 13bps lower, as fourth quarter rate cuts took place but uncertainty over the pace and timing of 2026 rate cuts limited rallies as more Fed officials stepped forward to proclaim that monetary policy was approaching a “neutral” position. With that backdrop, let’s turn our attention to changes in portfolio allocations during the past year.
Changes in Portfolio Allocations
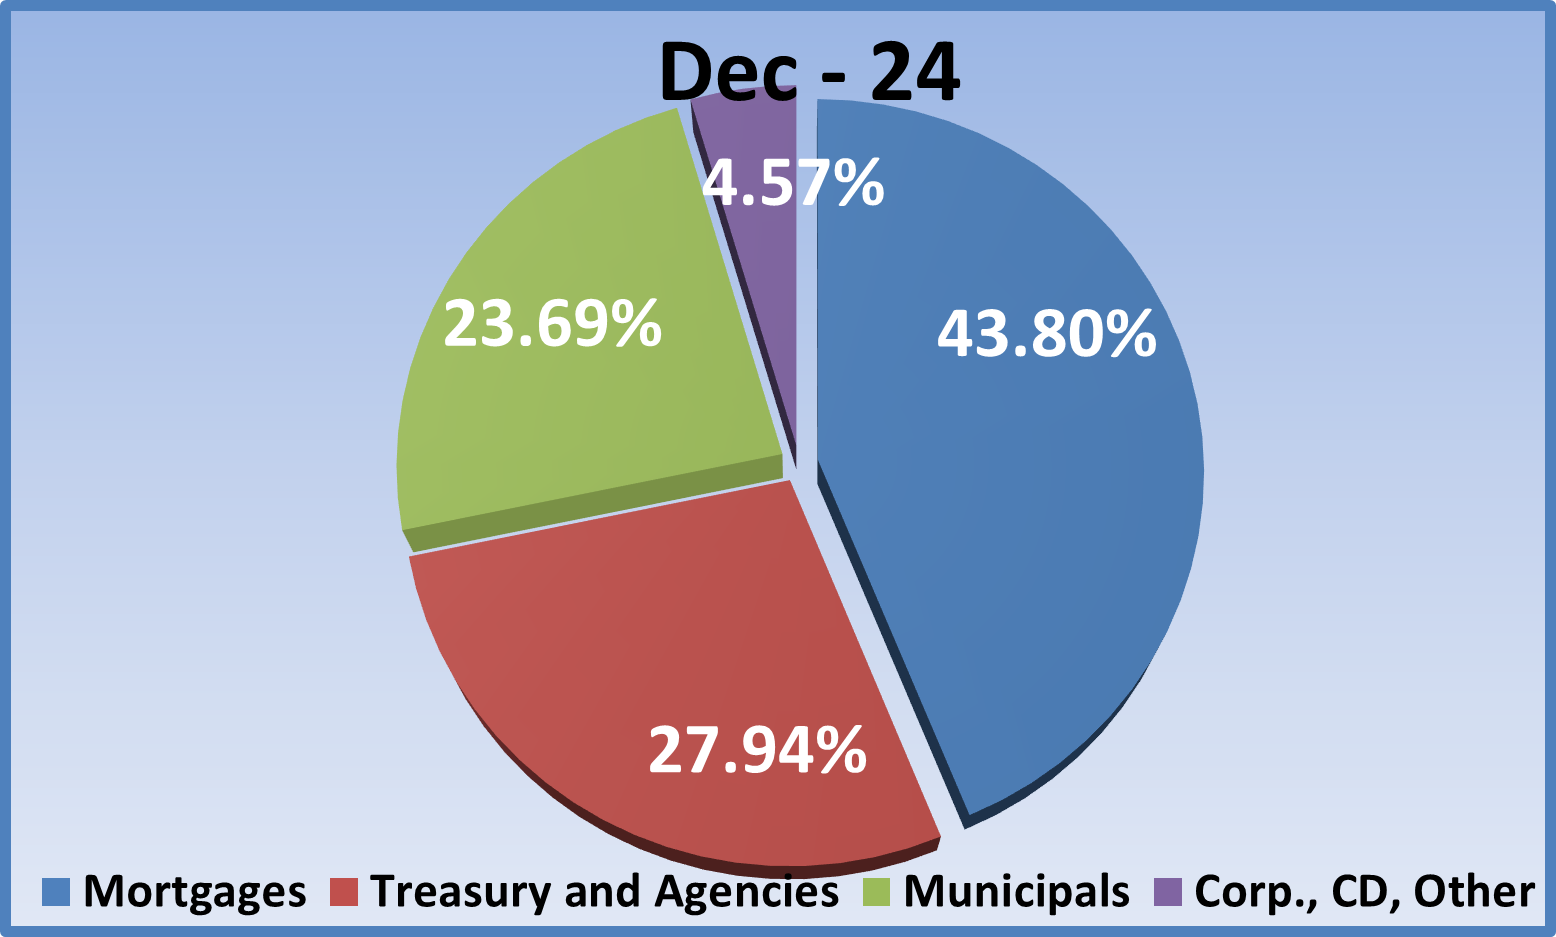
- Let’s begin our portfolio review by revisiting allocations a year ago as shown in the pie chart below. The MBS/CMO sector comprised 44% of the portfolio, Agency/Treasury investments were 28%, municipal allocations stood at 24%, and the “Other” category (CDs, corporates, and other floaters) 4.6%.
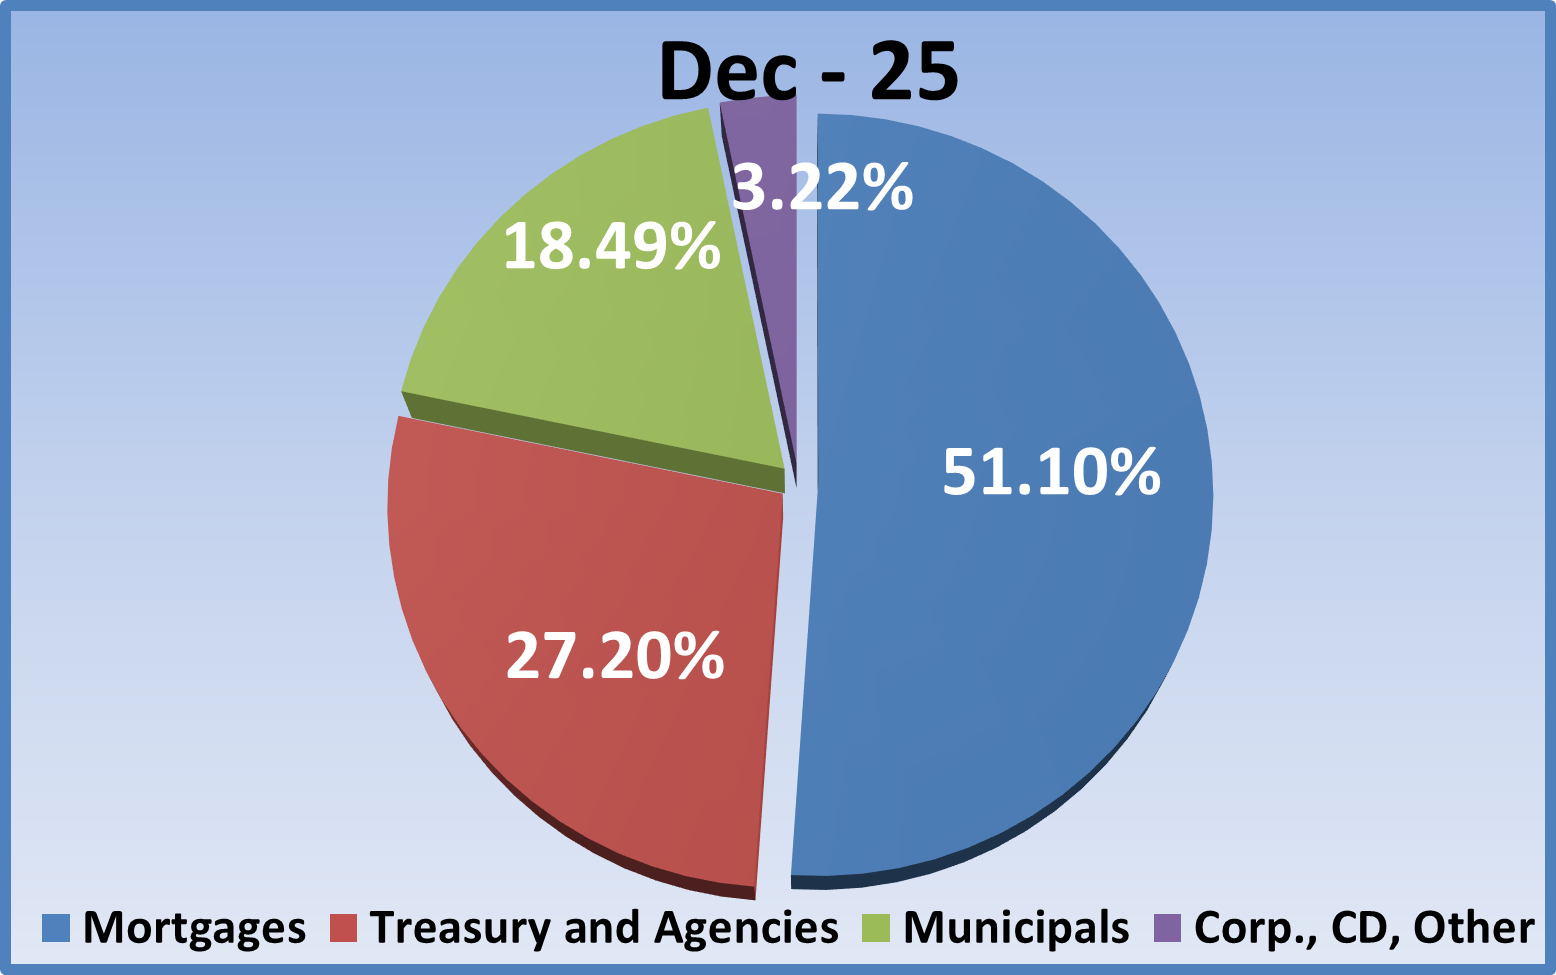
- Fast forward one year to December 31, 2025. The MBS/CMO sector comprised 51% of the portfolio, a solid 7% increase from last year. This repeats the experience of the past year which halted a prior multi-year trend of declining MBS allocations. Previous to the Fed’s rate hiking cycle begun in 2022, MBS tended to lead portfolio investments by a wide margin, close to 50% of total allocations, and as you see, we are back to that level again in 2025.
- The Agency/Treasury sector had been the one area that experienced increased allocations during the hiking cycle, but while leading the way in new quarterly purchases, the overall allocation held relatively steady, declining slightly from 27.94% a year ago to 27.20%. The “Other” category was smaller at 3.2% versus 4.6% a year ago with corporate bonds constituting more than 81% of the sector.
- The decrease in municipal investments that had been a feature for much of 2023 stopped in the fourth quarter of that year and that modest increase in allocation continued throughout 2024. During this year, however, additional investment has slowed again as investors shifted focus to MBS over municipal securities, perhaps due to duration concerns.
Changes in Portfolio Performance
Now let’s look at portfolio performance trends. The graph below tracks average portfolio tax-equivalent book yield, duration, and unrealized gain/(loss) as a percent of book value. It also tracks 10-year Treasury yields and average portfolio size over the last two years.
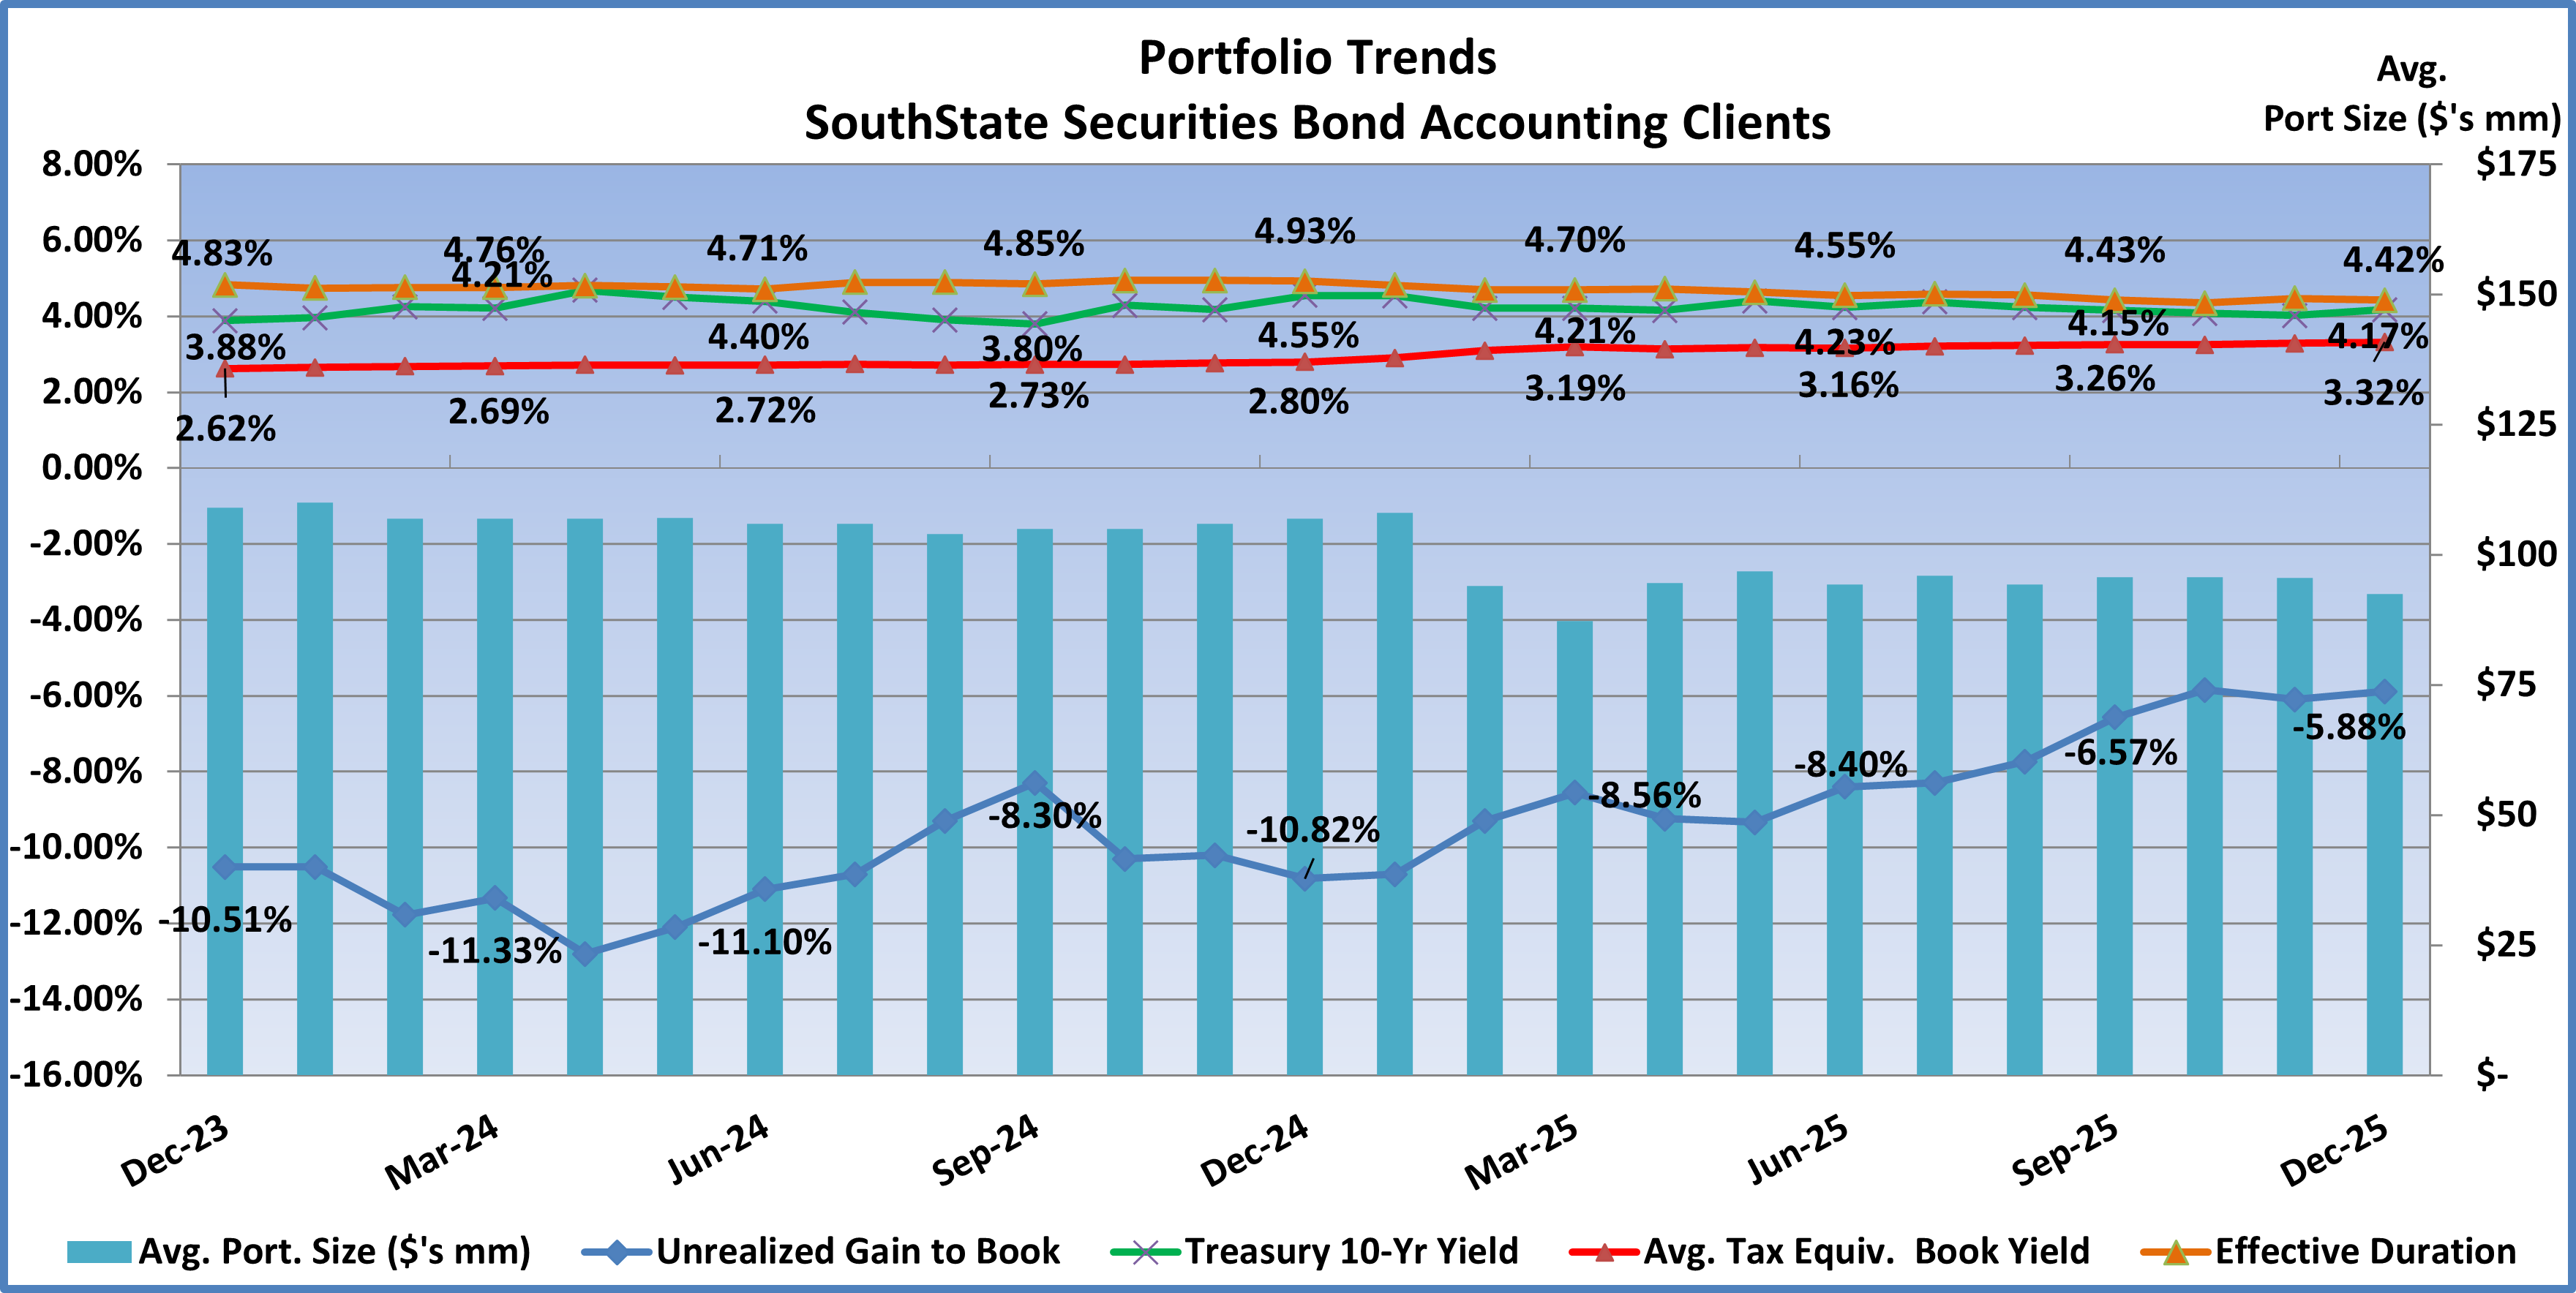
- Portfolio yields averaged 2.80% (red line) a year ago. Yields have risen through the year as reinvestments were made at higher market yields. By the end of the third quarter, yields had increased 46bps during the year to 3.26%, and improved another 6bps during the fourth quarter. We have been seeing 6 to 8bps in quarterly yield improvement over the prior two years so this most recent increase is in keeping with the longer-run trend.
- 10-year Treasury yields (green line) a year ago were 4.55% at year-end 2024. From there the trend in 2025 was generally lower as investors worried over the dual impact of tariffs on growth and inflation. When inflation was slow to materialize growth concerns moved into the spotlight and led the trend towards lower yields as the year unfolded. The 10yr yield finished 2025 at 4.17%, a modest 2bps increase during the quarter but 38bps lower for the year.
- Duration a year ago averaged 4.93 years and trended lower in 2025 on the back of declining market rates which accelerated prepayment and call expectations; thus, shortening durations. Fourth quarter duration stood at 4.42 years as modestly lower market rates and shorter-duration purchases contributed to the move lower during the year and quarter. The average duration is now the lowest since November 2021 and well off the 5.50 year high when rate hikes were beginning in March 2022.
- With the slight decrease in duration and short-term interest rates during the quarter unrealized losses improved. For the quarter, the unrealized loss decreased from –6.57% to –5.88% as a percent of book, that stands as the lowest unrealized loss since March 2022, when the Fed began its hiking cycle. The cycle worst remains the –16.00% unrealized loss in October 2023.
Portfolio Purchases During the Fourth Quarter 2025
- New investments during the fourth quarter increased from the third quarter’s $1.3 billion to $1.4 billion, or $10.7 million in purchases per portfolio. By way of comparison, in the fourth quarter 2024, purchases totaled $895 million, or $6.9 million per portfolio. So, quarterly purchases continue to increase which is a trend that began when the Fed shifted from rate hikes to cuts in late 2024. The run rate of purchases prior to the pandemic was approximately $1.2 billion per quarter and this is the second straight quarter where purchases have exceeded pre-pandemic levels.
- Despite the increase in quarterly purchases, it’s not enough to replace portfolio run-off; thus, average portfolio size continues to trend lower.
- Also, for the second straight quarter the Treasury/agency sector led purchases. Investments in the sector accounted for 50% of total purchases (44% Treasury, 6% agency). The 50% in new purchases compares to a legacy total of 27%. The MBS/CMO/SBA sector followed with 46% of total purchases vs. 51% in legacy allocation. The municipal sector was once again lapped by the top two categories with just 3% of purchases, ( 2.4% tax-free, 0.6% taxable). The 3% in muni purchases compares to a 18% legacy muni allocation.
- Average tax-equivalent book yield for fourth quarter purchases was 4.15% vs. 4.35% in the prior quarter. The average effective duration was 3.06 years versus 2.40 years in the prior quarter. So, investors earned less yield despite longer duration purchases vs. the third quarter which is an indication of the ongoing trend of lower market rates during the year and quarter. However, compare those quarterly metrics to the legacy portfolio book yield of 3.32% and effective duration of 4.42 years.
- We’ll be back in April with a review of first quarter performance and purchases.
Securities offered through the SouthState | DuncanWilliams 1) are not FDIC insured, 2) not guaranteed by any bank, and 3) may lose value including a possible loss of principal invested. SouthState | DuncanWilliams does not provide legal or tax advice. Recipients should consult with their own legal or tax professionals prior to making any decision with a legal or tax consequence. The information contained in the summary was obtained from various sources that SouthState | DuncanWilliams believes to be reliable, but we do not guarantee its accuracy or completeness. The information contained in the summary speaks only to the dates shown and is subject to change with notice. This summary is for informational purposes only and is not intended to provide a recommendation with respect to any security. In addition, this summary does not take into account the financial position or investment objectives of any specific investor. This is not an offer to sell or buy any securities product, nor should it be construed as investment advice or investment recommendations.