
Bond Portfolio Trends: Second Quarter 2026

Examining Bond Portfolio Trends: Second Quarter 2026
- Beginning in May 2012, we started tracking portfolio trends of our bond accounting customers here at SouthState Securities. At present, we account for over 130 client portfolios with a combined book value of $12.1 billion (not including SouthState Bank’s portfolio), or $94 million on average per portfolio. Twelve months earlier, the average portfolio size was also $94 million, representing an unchanged balance during the year.
Second Quarter 2026 Market Observations
- The second quarter of 2026, like the first, was characterized by a Fed standing pat on rates after cutting three times in the fourth quarter of 2025. Inflation concerns remained front and center during the quarter as a resolution to the Middle East hostilities and Strait of Hormuz bottleneck remained uncertain. These twin concerns kept market rates biased higher. Yet, rate movements remained somewhat contained as inflation concerns were met with increasing growth anxiety which kept upward yield moves limited.
- Short end yields, however, crept higher as early 2026 rate cut expectations were slowly dashed and replaced with increased rate-hiking odds. This pushed the 2yr yield from near 4.00% as the quarter began to a high of 4.23% in late June as new Fed Chair Kevin Warsh emphasized the Fed would bring inflation back to its 2% target. Since June, 2yr yields have drifted slightly lower as a mediocre June jobs report reminded investors of the growth concerns facing the economy.
- During the second quarter, just like in the first, the 10yr Treasury yield ended 15bps higher reflecting the ongoing push and pull between inflation concerns and slower growth expectations. Meanwhile, the 2yr Treasury finished the quarter 37bps higher as near-term rate cut expectations were dashed as inflation worries dominated most of the quarter. With that backdrop, let’s turn our attention to changes in portfolio allocations during the past year.
Changes in Portfolio Allocations
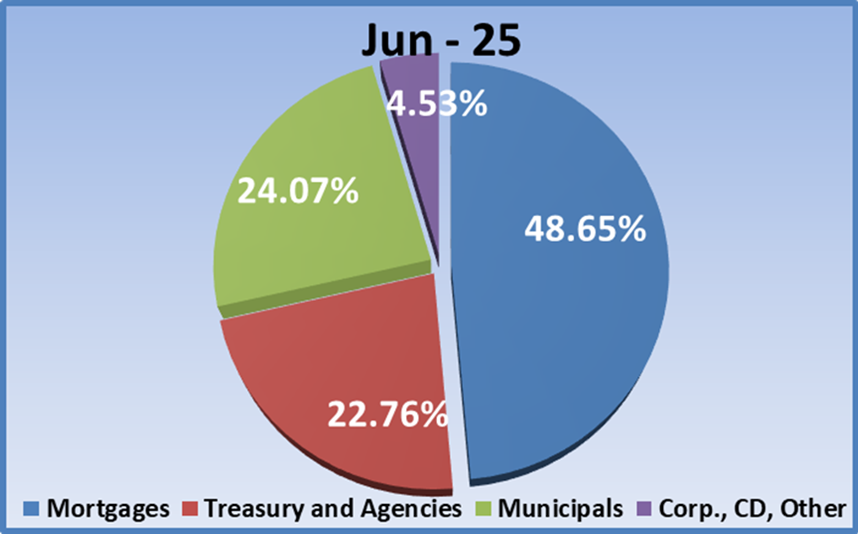
- Let’s begin our portfolio review by revisiting allocations a year ago as shown in the pie chart below. The MBS/CMO sector comprised 49% of the portfolio, Agency/Treasury investments were 23%, municipal allocations also stood at 24%, and the “Other” category (CDs, corporates, and other floaters) 4.5%.
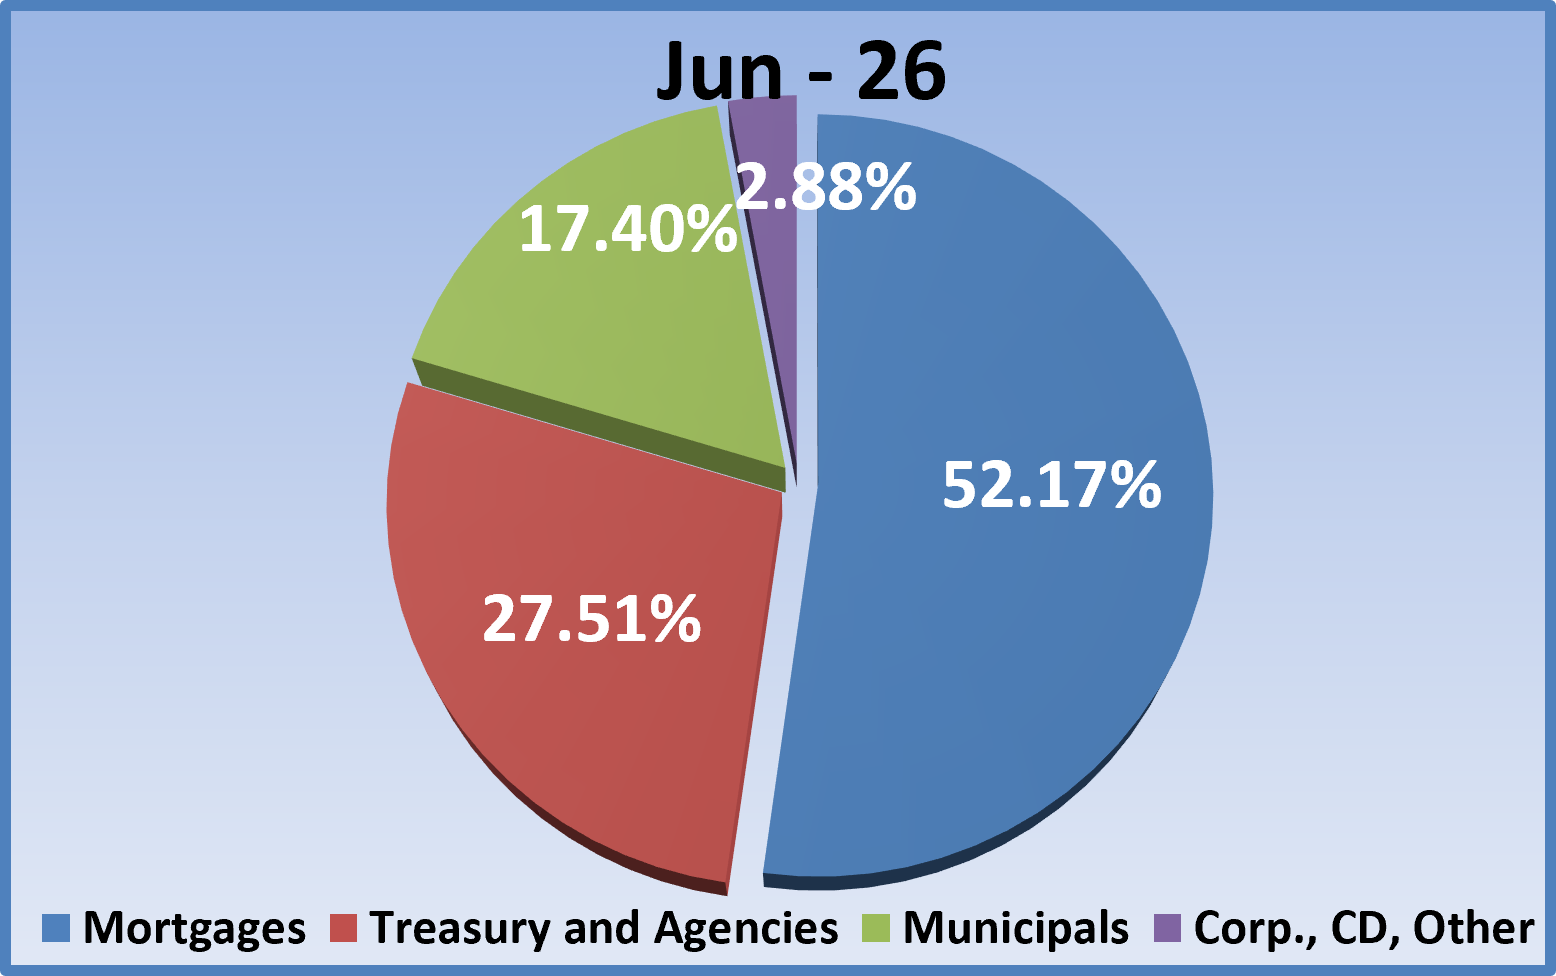
- Fast forward one year to June 30, 2026. The MBS/CMO sector comprised 52% of the portfolio, representing a 3% increase from last year. This repeats the experience of the past year which halted a prior multi-year trend of declining MBS allocations. Before the Fed’s rate hiking cycle begun in 2022, MBS tended to lead portfolio investments by a wide margin, typically 50% or more of total allocations, and we are back to that level again.
- The Agency/Treasury sector has been the one area that experienced increased allocations during the hiking cycle, but it’s also remained strong during the Fed’s rate-cutting period. Thus, allocations increased from 23% to 28% during the past year. The “Other” category was smaller at 3% versus 4.5% a year ago with corporate debt constituting more than 80% of the balance and CD’s the remainder.
- Municipal investments saw modest increases in allocation throughout 2024, but in 2025 additional investments slowed as investors shifted focus to MBS over municipal securities, perhaps due to duration concerns and this pattern has persisted in the first half of 2026 with municipal allocations down to 17% vs. 24% a year ago.
Changes in Portfolio Performance
Now let’s look at portfolio performance trends. The graph below tracks average portfolio tax-equivalent book yield, duration, and unrealized gain/(loss) as a percent of book value. It also tracks 10-year Treasury yields and average portfolio size over the last two years.
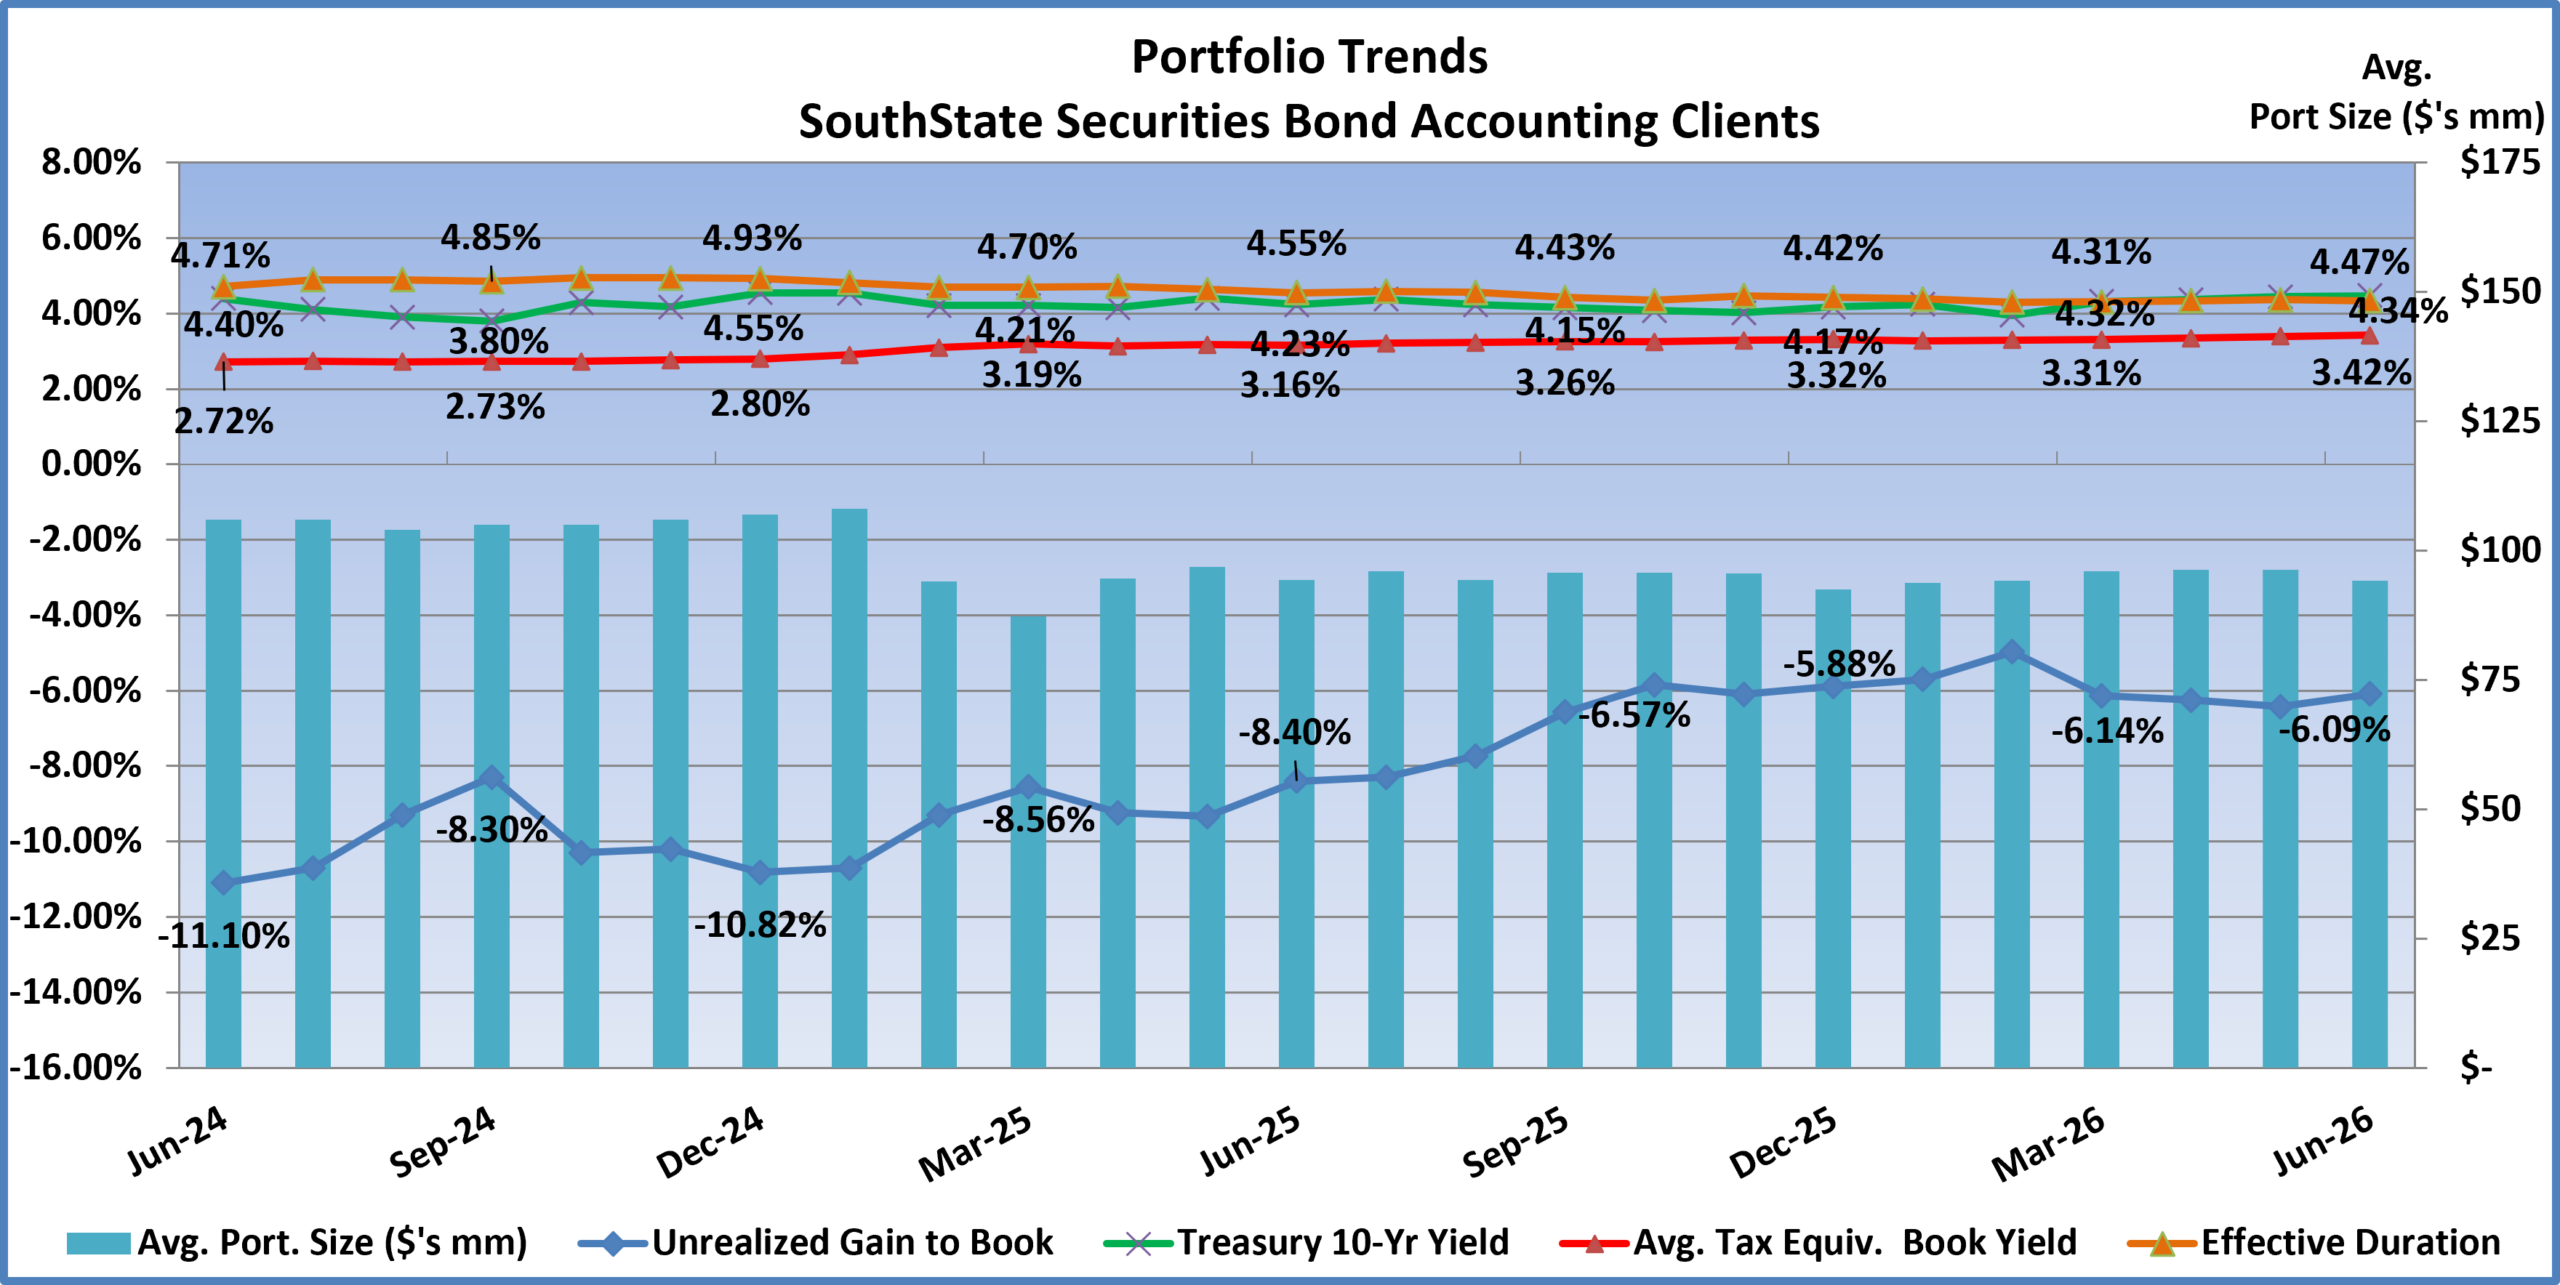
- Portfolio yields averaged 3.16% (red line) a year ago. As has been the pattern for a couple years now, yields have risen over the year as reinvestments were made at market yields exceeding legacy portfolio yields. By the end of June 2026, yields had increased 26bps from a year earlier to 3.42%. This increase in yield aligns with recent experience whereby quarterly yield improvement has averaged 7 to 8bps.
- 10-year Treasury yields (green line) a year ago were 4.23% and have moved little in the past twelve months as investors waffled between worries over inflation and growth, with inflation worries gaining the upper hand in the latest quarter. The 10yr yield ended the second quarter at 4.47%, a moderate 24bps increase during the past 12 months.
- Average duration a year ago was 4.55 years and trended lower throughout the period as new investments were generally shorter duration securities. The average duration at the end of the second quarter was basically flat at 4.34 years vs. 4.32 years in the first quarter. That duration is the lowest since August 2021 and well off the 5.50 year high when rate hikes began in March 2022.
- The average duration was essentially unchanged during the quarter as market rates inched higher on war-driven inflation concerns and that offset the lower duration purchases during the quarter. In the first quarter, the unrealized loss initially improved from –5.88% to –4.97% as a percent of book in February. That stands as the lowest unrealized loss in four years, just before the Fed began its hiking cycle in March 2022. With the inflationary concerns stemming from the Iran war, a modest increase in market yields since February stalled further improvement in the unrealized loss to position, ending the quarter at -6.09%.
Portfolio Purchases During the Second Quarter 2026
- New investments during the second quarter decreased slightly from the first quarter’s $1.5 billion to $1.3 billion, or $10.3 million per portfolio on average. By way of comparison, in the year ago quarter, purchases totaled $971 million, or $7.5 million per portfolio. So, quarterly purchases increased from year ago levels but decreased slightly on a sequential basis. That sequential slowing paused a trend that began when the Fed shifted from rate hikes to cuts in late 2024. The good news is the run rate of purchases prior to the pandemic was approximately $1.2 billion per quarter, so this is the fourth straight quarter where purchases exceeded pre-pandemic levels, despite the slight sequential decline.
- After trailing MBS product in the first quarter, the Treasury/agency sector returned to the top spot with a strong 54% of total purchases (50% Treasury, 4% agency). The MBS/CMO/SBA sector followed with 43% of the total. The municipal sector was once again lapped by the top two categories with just 1.6% of purchases, (1.2% tax-free, 0.4% taxable).
- Average tax-equivalent book yield for second quarter purchases was 4.12% vs. 4.20% in the prior quarter. The average effective duration was 2.26 years versus 2.85 years in the prior quarter. So, investors earned slightly less yield but with half-year shorter duration purchases vs. the first quarter. This pattern of slightly smaller purchases, with less duration, and a return to heavier Treasury investment, speaks to the increased uncertainty during the quarter stemming from the unsettled Middle East situation and to a lesser degree a new Fed chair coming into office.
- Despite slightly lower yields and less duration, compare the quarterly purchase metrics to the legacy portfolio book yield of 3.42% and effective duration of 4.34 years.
- We’ll be back in October with a review of third quarter performance and purchase analysis.
Securities offered through the SouthState | DuncanWilliams 1) are not FDIC insured, 2) not guaranteed by any bank, and 3) may lose value including a possible loss of principal invested. SouthState | DuncanWilliams does not provide legal or tax advice. Recipients should consult with their own legal or tax professionals prior to making any decision with a legal or tax consequence. The information contained in the summary was obtained from various sources that SouthState | DuncanWilliams believes to be reliable, but we do not guarantee its accuracy or completeness. The information contained in the summary speaks only to the dates shown and is subject to change with notice. This summary is for informational purposes only and is not intended to provide a recommendation with respect to any security. In addition, this summary does not take into account the financial position or investment objectives of any specific investor. This is not an offer to sell or buy any securities product, nor should it be construed as investment advice or investment recommendations.


