
Inflation Pressures Grow With Slight Softening in Consumer Spending

- A slew of new information yesterday confirmed what many of us suspected and that is inflationary pressures have arrived and are spreading, and that’s likely to continue amid little breakthrough in the Middle East conflict. Meanwhile, the consumer and labor market remain resilient to the early bout of inflation pressure but how much longer will that continue? That seems to be the next question the market will be dealing with. A small part of that answer may come later this morning with the ISM Manufacturing Survey with the much larger services side of the economy due next Tuesday. Currently, the 10yr is yielding 4.36% down 2bps on the day, while the 2yr is yielding 3.87% also down 2bps on the day.
- First off, Fed Chair Powell has decided to stay on as governor with his term extending to January 2028. That decision did not surprise us, but the three dissents (Logan, Hammack, and Kashkari), ostensibly objecting to the “easing bias” in the statement did surprise us as it sets up a potentially fractious FOMC that will greet incoming Fed Chair Kevin Warsh. The dissents were a clear message that talk of rate cuts need to be shelved and replaced with a neutral policy stance given the price pressure and ongoing uncertainty relating to the Middle East conflict. That’s a big reason you see no substantive odds of a rate cut this year, with odds building of rate hikes in 2027. That will keep short-end yields biased flat to higher, while longer end yields, while sensitive to the inflation threat, may welcome the more vocal hawkish inflation-fighting stance.
- 1st Quarter GDP was released yesterday, and it slightly disappointed at 2.0% QoQ annualized vs. 2.3% expected and 0.5% prior. Personal consumption eased from 1.9% in the fourth quarter to 1.6% vs. 1.4% expected. The metric that factors out more volatile items like inventory adjustments and net exports, Real Final Sales to Private Domestic Purchasers, rose 2.5% vs. 1.8% prior which highlights that while headline GDP may have missed, core consumption remained strong, primarily from data center building which is helping offset a modest softening in consumer spending. The question is will the consumer continue pulling back, and will the capex spending on data centers hold up to shoulder a larger economic burden?
- Included in GDP was the March Personal Income and Spending Report, and it provided some interesting tidbits of March behavior that may persist into the second quarter. Overall income increased 0.6% vs. an unchanged February and double the 0.3% expectation. A chunk of that gain came from outsized farm income that doubled over recent results; so, that tempers the beat to an extent. As an aside, the separately issued 1st Quarter Employment Cost Index rose 0.9% vs 0.8% expected with the YoY rate at 3.4% which continues a slowly declining trend in annual real income gains, but it remains above pre-pandemic gains (see graph below).
- Personal spending rose 0.9% but 40% of that came from higher energy/gas costs as real spending (adjusted for inflation) rose a more moderate 0.2%, which missed the 0.3% expected which was also the upwardly revised February result. The spending was more focused on essential items vs. discretionary (see table below) which may be a foreboding sign for future consumption if price pressures continue in coming months, especially if income levels continue to moderate.
- The Fed’s preferred inflation measure, PCE, rose 0.7%, matching expectations and increasing YoY from 2.8% to 3.5%. Core PCE (ex-food and energy) rose a more moderate 0.3%, also matching expectations, with the YoY pace increasing from 3.0% to 3.2%. It seems reasonable to assume core inflation will continue to increase if the Middle East conflict continues and energy costs/supply constraints spread more broadly across products and services. That’s another reason that odds of a rate cut this year have been essentially wiped off the board.
- As far as the other piece of the Fed’s mandate – full employment – the latest Initial Jobless Claims numbers were even softer than in recent weeks with claims falling from 215 thousand to 189 thousand last week. That’s the lowest claims result in the post-pandemic period (lowest since 1969 actually) and indicates the low-fire environment continues. Continuing claims also fell – to a four-year low – dipping from 1.808 million to 1.785 million (see graph below). These weekly jobless claims figures may be the canary-in-the-coalmine as we look for indications of labor market slippage if spreading price pressure eventually reduces demand. So far, that’s not the case but keep your eyes peeled.
- The ISM Manufacturing Index for April will be released at 10am ET and is expected to improve from 52.7 to 53.2. The S&P Global PMI series released last week reported a strong showing for the manufacturing side, but it was talked down as more to do with pre-emptive inventory stocking prior to further price increases and/or supply constraints. We’ll see if the ISM narrative is the same. The prices paid component, unsurprisingly, is expected to increase to 80.0 from 78.3. If it matches expectations that would represent a four-year when prices were coming off the 2020-2021 inflation spikes.
Employment Cost Index (YoY) – Income Gains Moderate, but Still Above Pre-Pandemic Levels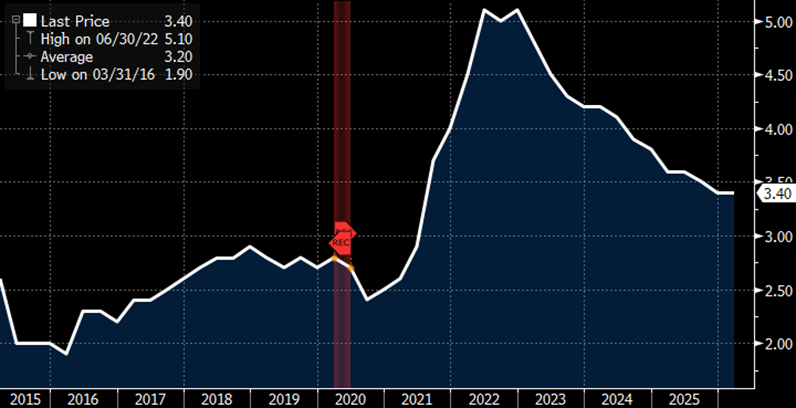 Source: US BLS
PCE and Core PCE (YoY) – The Uptick Begins as Higher Energy Costs Arrive in the Data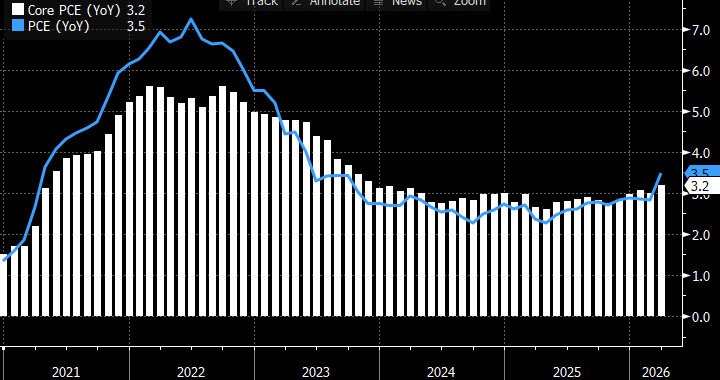 Source: US BEA
Personal Spending in March Dominated by Energy/Gas – Health Care a Distant Second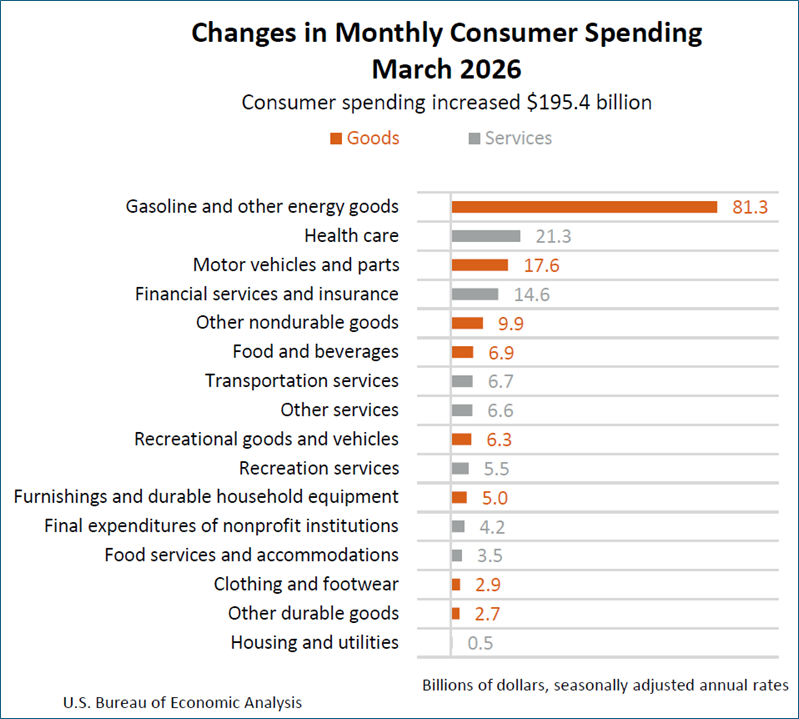 Source: Dept. of Labor
Initial and Continuing Jobless Claims – Low-Fire Environment Continues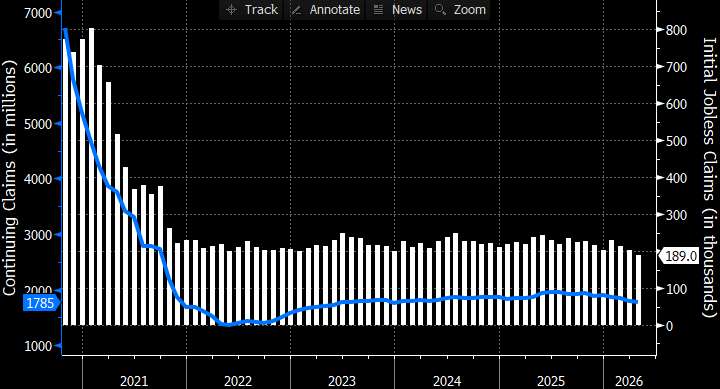 Source: US Dept. of Labor
Securities offered through the SouthState | DuncanWilliams 1) are not FDIC insured, 2) not guaranteed by any bank, and 3) may lose value including a possible loss of principal invested. SouthState | DuncanWilliams does not provide legal or tax advice. Recipients should consult with their own legal or tax professionals prior to making any decision with a legal or tax consequence. The information contained in the summary was obtained from various sources that SouthState | DuncanWilliams believes to be reliable, but we do not guarantee its accuracy or completeness. The information contained in the summary speaks only to the dates shown and is subject to change with notice. This summary is for informational purposes only and is not intended to provide a recommendation with respect to any security. In addition, this summary does not take into account the financial position or investment objectives of any specific investor. This is not an offer to sell or buy any securities product, nor should it be construed as investment advice or investment recommendations.


