Is the Labor Market Taking Another Leg Lower?

- Yesterday brought an array of data that all seemed to line up agreeing that the labor market is taking another step back. Whether it was JOLTS with its significant dip in job openings, initial jobless claims moving decidedly higher, or Revelio Labs reporting 13 thousand jobs lost in January, the message to the Fed is don’t be too sanguine about stability in the labor market, the ground could be shifting under your feet. Add in the selling in previously hot risk sectors like bitcoin, software stocks, and now spreading to tech darlings, the wealth effect is taking a hit. Will consumption follow? Maybe not, but it certainly adds importance to the coming nonfarm payrolls report next Wednesday and CPI on Friday. Currently, the 10yr is yielding 4.20%, down 1bp, while the 2yr is yielding 3.48%, also down 1bp on the day.
- The slightly delayed release of the Job Openings and Labor Turnover Survey (JOLTS) for December had some unwelcome news. The headline Job Openings indicator fell to 6.542 million compared to 7.250 million expected and 6.928 million the prior month. This is the lowest level of job openings since September 2020, and November’s total was revised down 218 thousand. The job openings to jobless ratio slid to 0.87 from 0.89. This is the lowest since March 2021. Those not wanting to make too much of the drop in openings will point to the unchanged quits rate and layoffs rate — at 2.0% and 1.1%, respectively. The hiring rate rose to 3.3% from 3.2%.
- It’s interesting to note that in the spring of 2020, job openings at the beginning of the shutdown period and all the uncertainty of what’s ahead bottomed at 4.6 million job openings. Thus, it seems that level represents something of a floor or ghost listings, not true indicators of labor need, but a weathervane of sorts. In any event, we find ourselves close to that level again and that should be concerning to a Fed that is banking on labor market stability to maintain their pause stance until inflation moves closer to the 2% target.
- Initial jobless claims for the week of January 31 came in sharply higher-than-expected at 231 thousand vs. 209 thousand prior and 212 thousand expected. The 4-week moving-average increased to 212.25 thousand (five-week high) vs. 206.25 thousand prior. Meanwhile, Continuing Claims were 1.844 million vs. 1.819 million prior and 1.850 million expected. While the uptick in claims is not historically high, it does represent the highest level this year, admittedly that’s just over one month, and combined with other data received today aligns with the theme of a labor market taking another step back.
- Also released yesterday, Revelio Labs reported a 13 thousand drop in January non-farm payrolls, as dips in public administration (read government), leisure and hospitality, and retail trade couldn’t offset growth in the usual suspects of health care and education. It represents the lowest print in series history going back to Jan. 2021. December’s initial print of 71 thousand was revised lower to 34 thousand. Earlier yesterday, the Challenger job cuts report revealed 108,435 January layoffs – a 118% increase on a year-over-year basis, and the highest total job cut announcements for January since 2009 when the Great Financial Crisis fallout was peaking.
- On Wednesday, the ISM Services Index for January was released and a slowdown in orders and employment offset faster production kept the index unchanged at 53.8. The acceleration in input costs in January (66.6 Jan. vs. 66.1 Dec.) will be troubling for Fed officials. The new-orders subindex faded to 53.1 from 56.5 prior, indicating a slower growth pace and other demand-side factors softened, with orders for export falling and inventory sentiment pointing to production headwinds in the months ahead. The employment measure slipped to 50.3 vs. 51.7 in December, just above the 50 dividing line.
- Despite the softening demand, and slowing headcount growth, price pressures surprised to the upside (66.6 vs. 65.1 Dec.). Respondent comments were dominated by concern over increasing input costs that were becoming harder to avoid and/or absorb. In summary, the flat employment indicator, along with increasing pricing pressure and slowing new orders paints an uncertain picture for the dominant services-side of the economy. In a way, it reflects the downbeat labor-related releases from yesterday and that combination will get the Fed’s attention.
- Meanwhile, the crypto complex is going through some things, namely heavy selling. That combined with the selling in silver highlights the reversal in fortune in previously high-flying sectors that are having a tough go of it so far in 2026. Add in the heavy selling in software stocks that is now spread across tech in general and it’s not hard to begin worrying about the wealth effect and the possible derivative damage to future consumer spending. In conjunction with that last point, look at the latest TSA screening statistics in the graph below. The latest statistics show aircraft boardings slowing to two-year lows. Again, it may be early days but some softening in consumption could already be occurring.
JOLTS – Job Openings Fall to 2020 Levels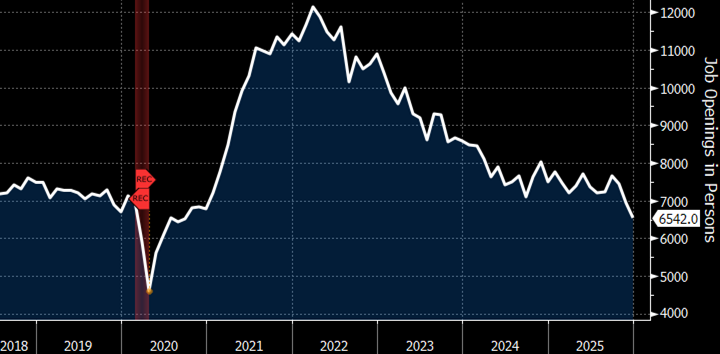 Source: BLS
Bitcoin – Some Tough Days in Crypto Land. Will This Crimp Consumption?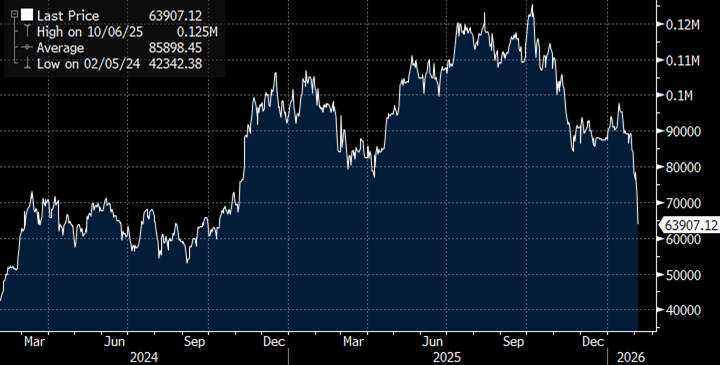 Source: Bloomberg
Revelio Labs – 13 thousand Jobs Lost in January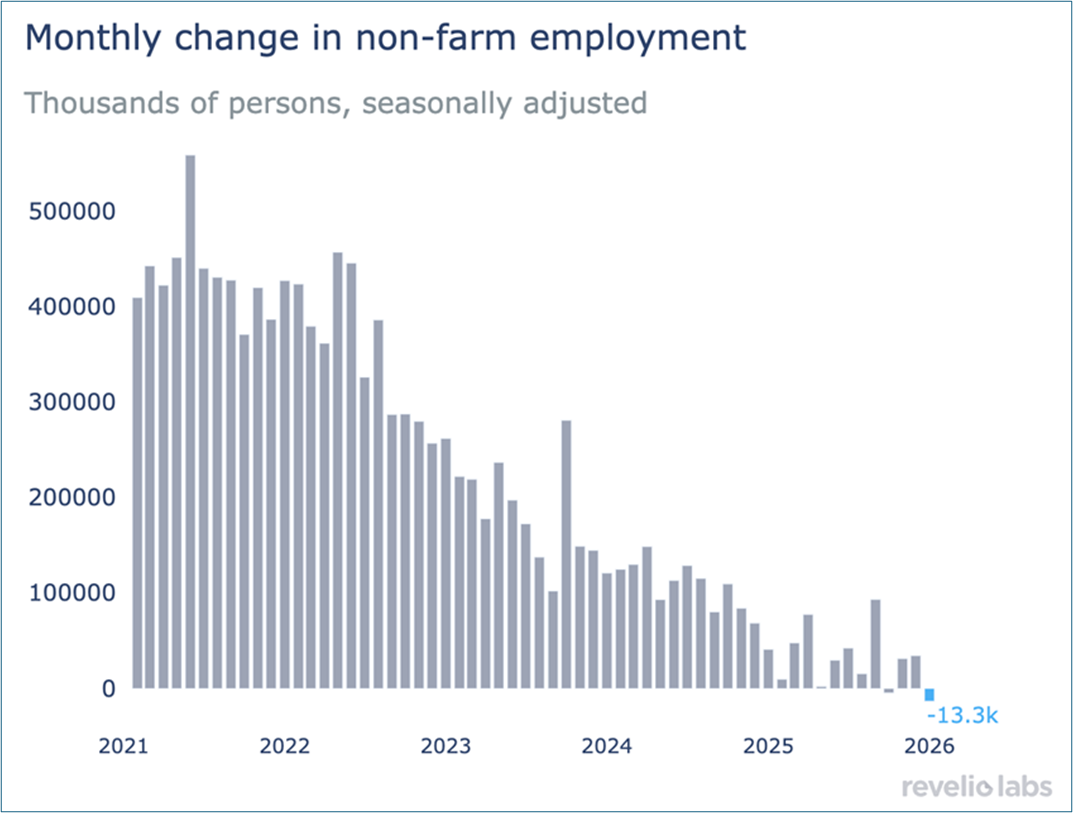 Source: Revelio Labs
Challenger Job Cut Announcements – Highest January Since 2009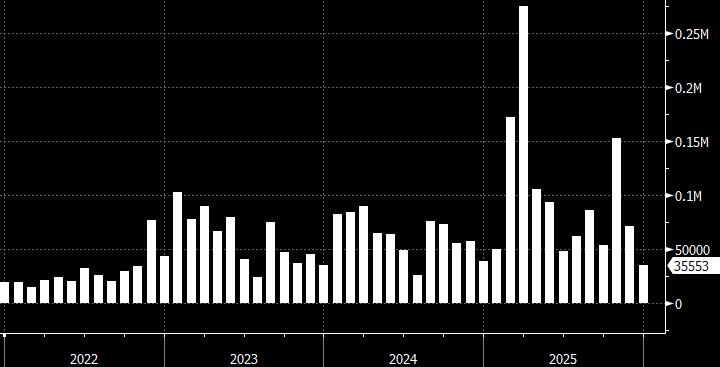 Source: Challenger Job Cuts
TSA Weekly Security Screenings – Boardings Dip to Lowest Level in Two Years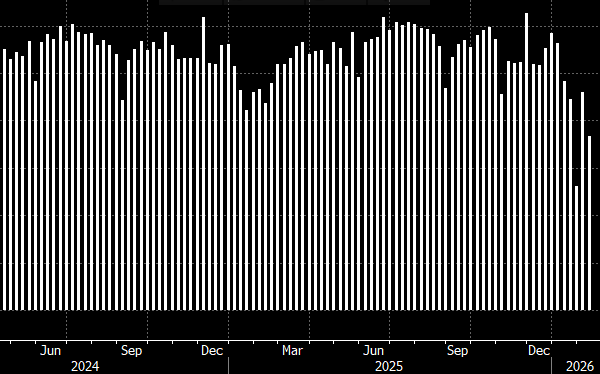
Source: TSA
Securities offered through the SouthState | DuncanWilliams 1) are not FDIC insured, 2) not guaranteed by any bank, and 3) may lose value including a possible loss of principal invested. SouthState | DuncanWilliams does not provide legal or tax advice. Recipients should consult with their own legal or tax professionals prior to making any decision with a legal or tax consequence. The information contained in the summary was obtained from various sources that SouthState | DuncanWilliams believes to be reliable, but we do not guarantee its accuracy or completeness. The information contained in the summary speaks only to the dates shown and is subject to change with notice. This summary is for informational purposes only and is not intended to provide a recommendation with respect to any security. In addition, this summary does not take into account the financial position or investment objectives of any specific investor. This is not an offer to sell or buy any securities product, nor should it be construed as investment advice or investment recommendations.