
July PCE Inflation Mostly as Expected, Real Spending Slightly Soft

- A couple key reports arrived this morning with July Personal Income and Spending, including the Fed’s preferred inflation measure, PCE, and the second estimate of 2nd quarter GDP. We discuss those reports in detail below. Meanwhile, the fallout from the failed trade negotiations with Canada continues. The Canadians wasted no time in levying retaliatory tariffs on US goods from aluminum foil to dishwashers to fish beginning on September 8. The most significant of the 700 items assessed levies are a doubling of tariffs on American steel and aluminum to 50%. Unsurprisingly, many of the items come from states that have hotly contested races in the upcoming election. The list reportedly constitutes just $20 billion in goods which is less than 10% of the $272 billion that Canada imports from the U.S. in a typical year. So, they’ve left plenty more to pick from should this escalate further. There’s also, once again, the matter of whether the U.S. tariffs are even legal. This time the administration is using Section 338 of the Tariff Act of 1930 which has never previously been invoked. So, that’s an issue that will get decided in due time, but for now, the tit-for-tat will play on. Currently, the 10yr is yielding 4.66% up 2bp, while the 2yr is yielding 4.22%, up 1bp on the day.
- The last of the July inflation numbers, and the Fed’s preferred measure, arrived this morning in the Personal Income and Spending report. Core PCE rose 0.2% as expected but higher than the 0.1% June reading. YoY core PCE rose 3.3%, also matching expectations, and June’s result. Overall PCE increased 0.2%, above the 0.1% expectation and the -0.1% June result as gas prices resumed their climb in July as the Iranian ceasefire dissolved. The YoY rate YoY rate remained at 3.7% vs. 3.6% expected. It was at 4.1% in April as gas prices hit their cycle high. The core PCE rate, while matching expectations, was higher than the core CPI YoY rate of 2.5% and that will be something the Fed’s recently convened data measurement task force will no doubt be looking at.
- The disparity between CPI and PCE persists. One thing helping CPI is the higher weight on housing (largest single item in CPI) and with that component in a disinflationary phase it’s helping push CPI below PCE. That is certainly something the FOMC will consider when they convene next month, but whether they hike or not is a question that will remain unresolved until the August CPI and jobs reports are published prior to the September 16 rate decision. Right now, odds are approximately 30% for a hike.
- Another key figure in the report was personal spending for July that increased 0.2% vs. 0.1% expected and 0.3% in June. However, spending adjusted for inflation (Real Spending) was flat for the month vs. up 0.4% in June. That slowing in real spending was due to both less spending and slightly higher inflation during July. The spending encompassed in this report is more comprehensive than the Retail Sales results reported earlier this month, but it does match the slowdown noted in that report. This may become a bigger concern if the spending slowdown morphs into a trend rather than a one-month hiccup. It’s another item to check when the Fed meets in September.
- The second estimate of second quarter GDP met expectations and unchanged from the first estimate at 1.5% annualized. Consumer consumption remained strong in the second update, increasing 3.4% vs. 3.2% expected and 3.2% in the first estimate. The metric that focuses on private domestic demand, Real Final Sales to Private Domestic Purchasers, (consumer spending plus business investment) rose 4.2% vs. 3.9% in the first estimate and up from 1.7% in the first quarter, illustrating the solid showing from two key players in the economy. On the inflation front, the GDP deflator increased 5.8% annualized vs. 5.7% in the first estimate as higher energy prices early in the quarter weighed on results. Core PCE (ex-food and energy) rose 3.6% annualized vs. 3.4% in the first estimate.
- Another report from yesterday was the Conference Board’s latest read on consumer confidence for August. Confidence declined slightly from July (89.4 vs. 90.2) and missed the 90.2 expectation. The dip was driven by the Expectations index (short-term outlook for income, business, and labor market conditions) which fell from 74.0 to 68.2, the lowest reading since January’s 67.2. All three measures, income, business, and labor market conditions fell vs. July. The Present Situation reading, however, increased from 114.4 to 121.2, the highest reading since April, softening some of the moderate drop in expectations.
- Inflation expectations for the next year ticked higher from 5.6% to 5.8%, the first uptick since March. Consumers’ write-in responses on factors affecting the economy were slightly more pessimistic in August. References to prices in general—and oil and gas specifically—remain elevated. Comments about war/conflict, food/groceries, trade, and jobs rose in August.
- Finally, the Labor Differential measure (Jobs Plentiful – Jobs Hard to Get) increased from a downwardly revised July reading of 2.7 (originally 3.1) to 7.5. The August improvement was driven mostly by an increase in Jobs Plentiful responses and matches April as the highest reading this year (see graph below). That said, prior to this year, the August Labor Differential print remains the lowest since February 2021.
Services Dominate Top July Spending Categories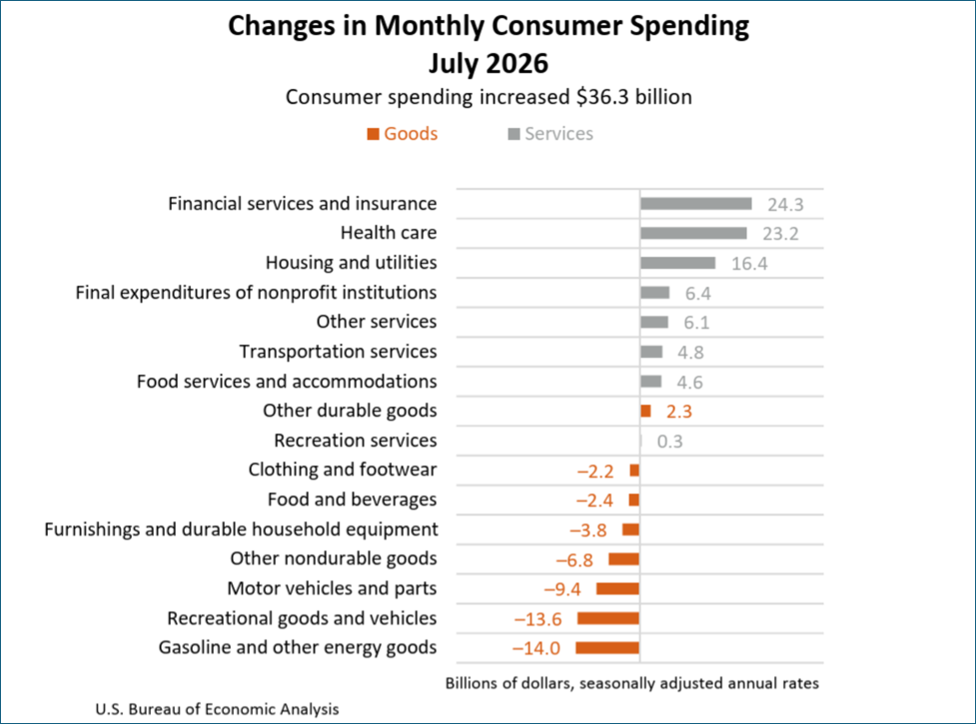 Source: BEA
July PCE Inflation – Hotter on Overall 3.7% vs. 3.6% Expected, Core as Expected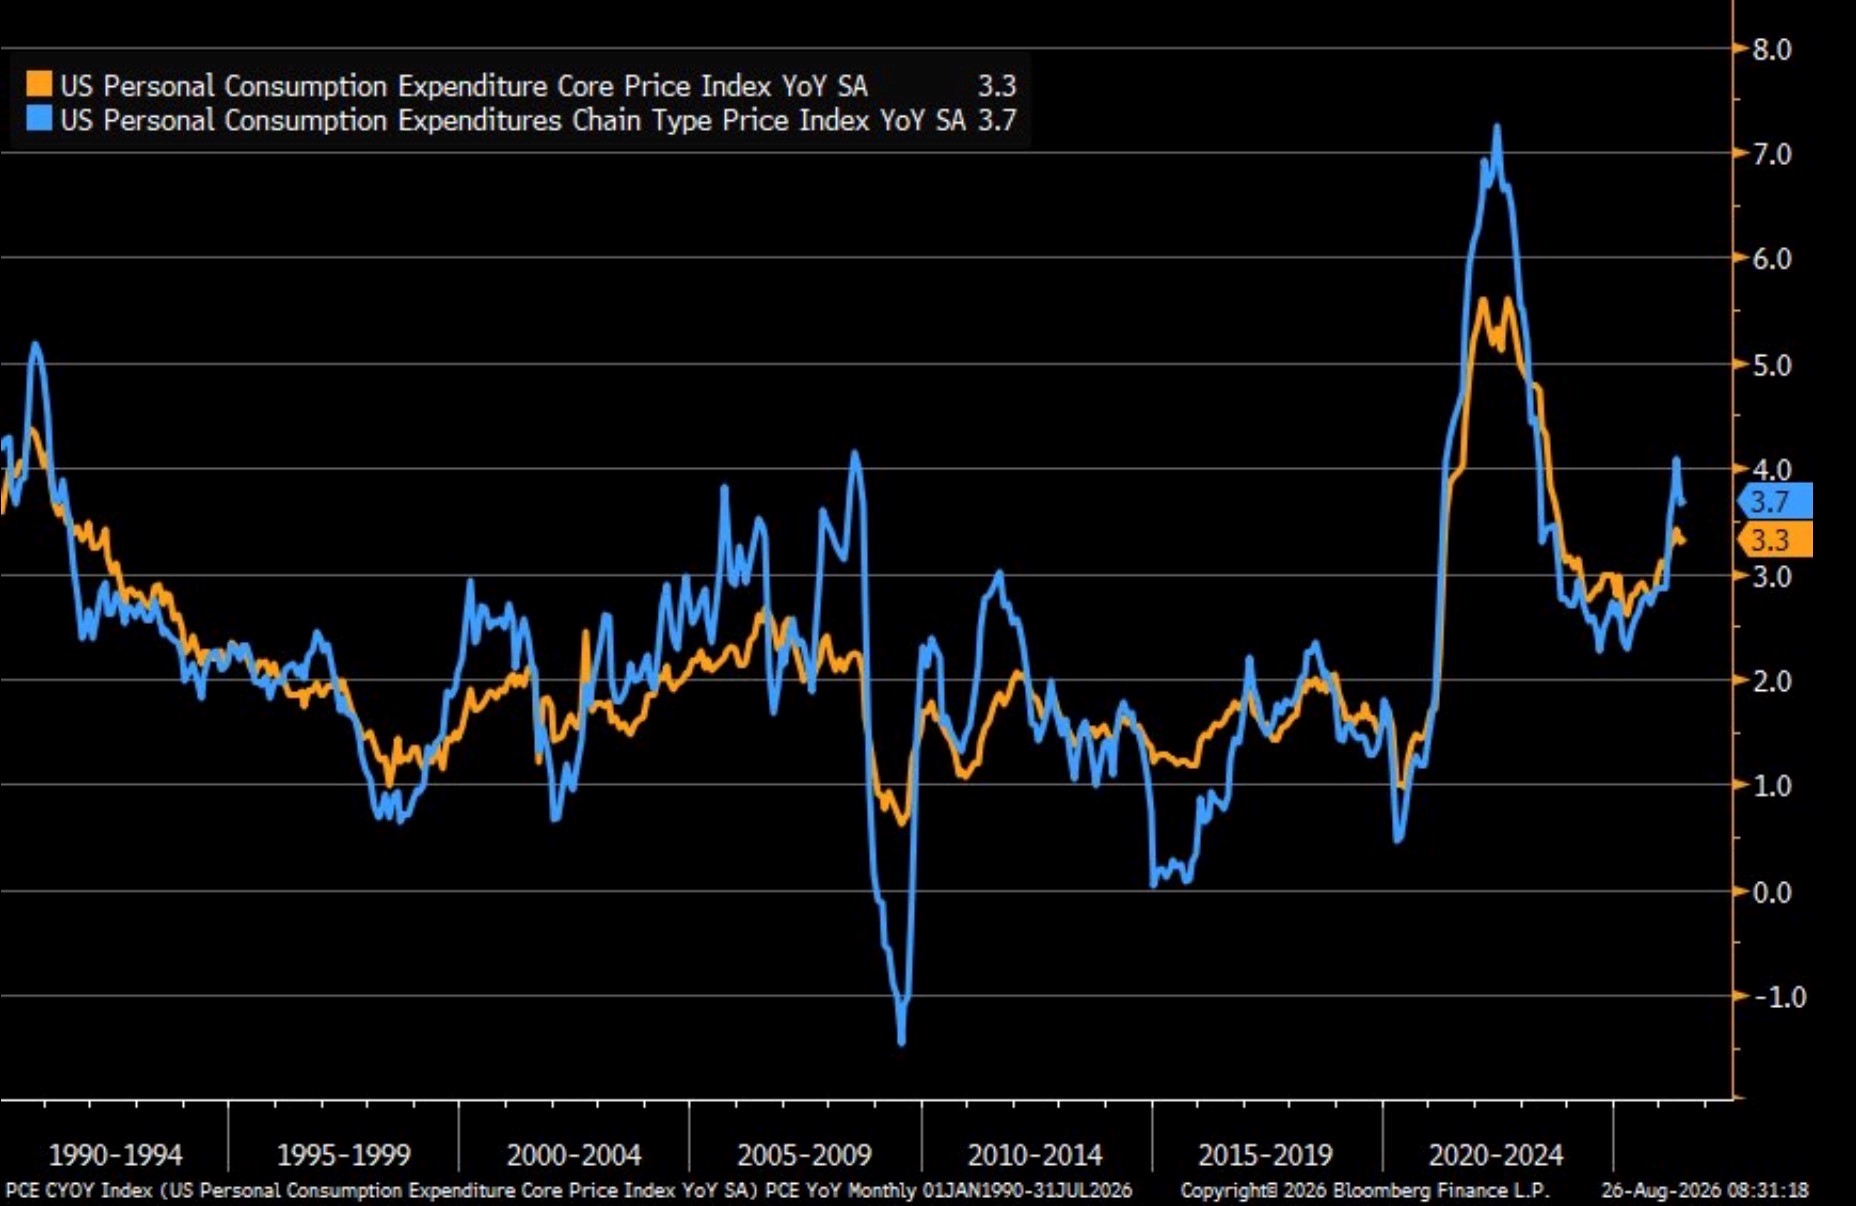
Source: BEA
Conference Board’s August Confidence Reading and Expectations Edges Lower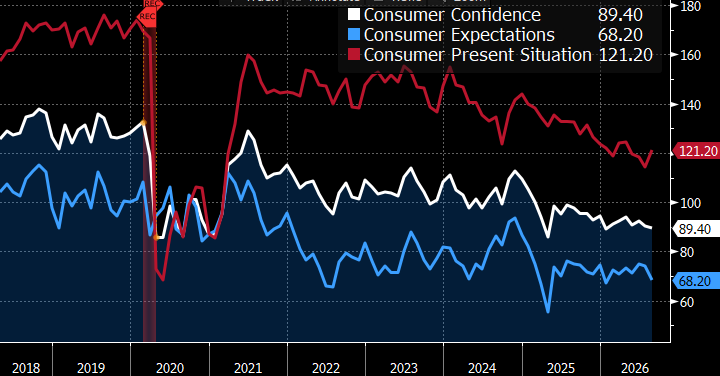 Source: Conference Board
Conference Board Inflation Expectations Slip Lower at 1yr, Unchanged at 5yr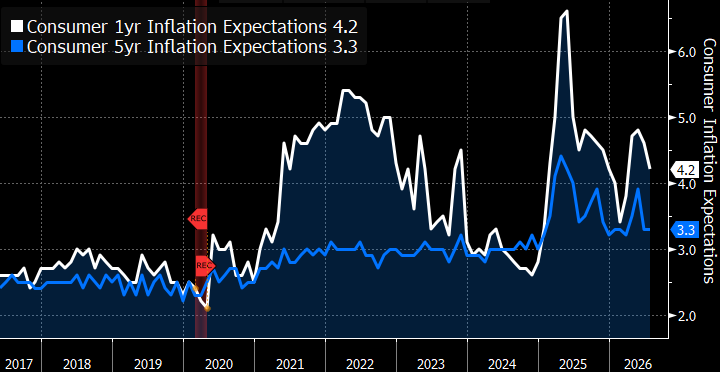 Source: Conference Board
Labor Differential Improves on Increased Jobs Plentiful Reading – Remains Historically Low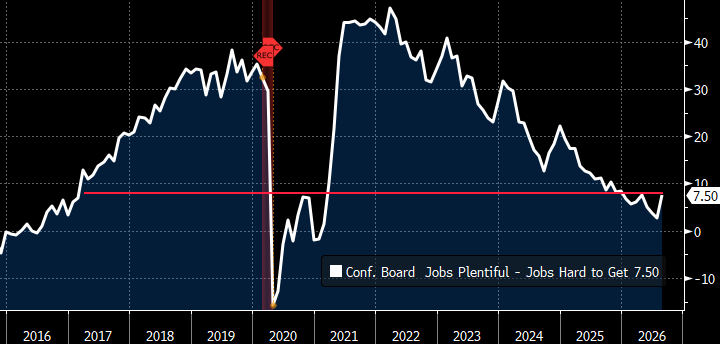
Source: Conference Board
Securities offered through the SouthState | DuncanWilliams 1) are not FDIC insured, 2) not guaranteed by any bank, and 3) may lose value including a possible loss of principal invested. SouthState | DuncanWilliams does not provide legal or tax advice. Recipients should consult with their own legal or tax professionals prior to making any decision with a legal or tax consequence. The information contained in the summary was obtained from various sources that SouthState | DuncanWilliams believes to be reliable, but we do not guarantee its accuracy or completeness. The information contained in the summary speaks only to the dates shown and is subject to change with notice. This summary is for informational purposes only and is not intended to provide a recommendation with respect to any security. In addition, this summary does not take into account the financial position or investment objectives of any specific investor. This is not an offer to sell or buy any securities product, nor should it be construed as investment advice or investment recommendations.


