May Jobs Report Easily Beats Expectations, Unemployment Rate Unchanged

- May nonfarm payrolls rose 172 thousand, easily beating the 85 thousand expected and slightly less than the 179 thousand gained in April (revised higher from an initial 115 thousand). Two-month revisions added 93 thousand jobs from previous estimates. Compared to the usual downward revisions that’s a huge shift. Also, the May gain marks three straight months of better than 150 thousand gains, something of a surprise after several weaker months at the turn of the year. Job gains remained strong in areas that we’ve come to expect, namely healthcare with +40k, but Leisure and Hospitality surprised with a strong +70k gain, and government got into the act with +52 thousand new jobs, that’s quite the shift after months of shedding jobs.
- The Household Survey is smaller than the Establishment Survey and subject to more volatility, but it generates the important unemployment rate, labor force participation rate, etc.. The survey reported an increase of 83 thousand people in the labor force (those employed and those not working but actively looking for employment) and a 66 thousand decrease in unemployed persons. The report also found 149 thousand new jobs. The unemployment rate remained at 4.3% (4.30% unrounded vs. 4.26% in April), for a third straight month. The small increase in the labor force halts a previous two-month decline. Despite the small labor force increase the Labor Force Participation Rate remained at 61.8%, matching the forecast.
- Meanwhile, Average Hourly Earnings rose 0.3% MoM, matching expectations and beating the April 0.2% gain. Despite the uptick in monthly wages, the year-over-year pace decreased two-tenths to 3.4%, also matching expectations. Average weekly hours remained unchanged at 34.3 hours, as expected. Bottom line, YoY wage gains dipped as a large 0.4% gain from last May rolled off and was replaced with the 0.3% May gain this year. With annual wage gains in the mid 3% level, and inflation moving towards 4%, and likely higher, real incomes have turned negative and are likely to get worse in the second half of this year. Maintaining consumption levels in that environment will be a major challenge.
- Bottom line: with the reported solid job growth, stable unemployment rate, and stable wage gains, the Fed can remain patient for the inflation picture to improve. That said, the drop in real incomes, due to increasing inflation, is likely to persist. The energy price spike has already begun spreading into other sectors and that will continue. That will increasingly challenge the Fed as they wait on inflation pressure to ease. Thus, the inflation/growth dilemma will continue dominating trading with the market expecting a Fed on hold this year, and perhaps rate hikes in 2027. That expectation will not be altered by today’s jobs report.
- The ISM Services Index was released Wednesday and provided a mixed picture on the services side of the economy. The overall index improved to 54.5 vs. 53.6 in April, easily beating the 53.8 expectation. That represents solid expansion in the largest segment of the economy, second only to the 56.1 spike in February. Before that, one must go to October 2024 for a higher reading. Much like the manufacturing sector, the Prices Paid Index received plenty of scrutiny with the index increasing to 71.3 from 70.7 but coming in lower than the to 72.3 expectation. Still, it was the highest print for the index since October 2022 (see the graph below for all the monthly measurements.
- Meanwhile, New Orders jumped from 53.5 to 57.3, easily beating the 53.4 expected. Some of the commentary, however, centered on pulling forward demand to beat anticipated higher future prices, so that tempered some of the enthusiasm for the strong print. Other demand-side factors like exports and order backlogs softened and some respondents reported inventories growing more rapidly. Finally, the Employment Index dipped from 48.0 to 47.9, keeping employment in contraction territory and that speaks to the ongoing moderation in the labor market. In summary, this report highlights the slowing momentum in the labor market, but expansion continued. That could soften in future months given weaker exports and building inventories. Thus, a more mixed picture of the services sector is evident compared to what the headline index implies.
- Finally, initial jobless and continuing claims continue with the low-fire theme while the jobs report maintains the low-hire theme. Initial claims for the week ending May 30 rose from 212 thousand to 225 thousand. The 4-week average increased from 208.25 thousand to 214.75 thousand. Meanwhile, continuing claims for the week ending May 23 fell from 1.785 million to 1.777 million. As the graph below shows, however, little has changed between the two measures for months now as companies have slowed hiring but remain content to hang onto employees through the current war-induced uncertainty. The uptick in initial claims is somewhat interesting, but it would have to be followed by more of the same before a trend of higher layoffs is confirmed.
New Hires Spread into Several Categories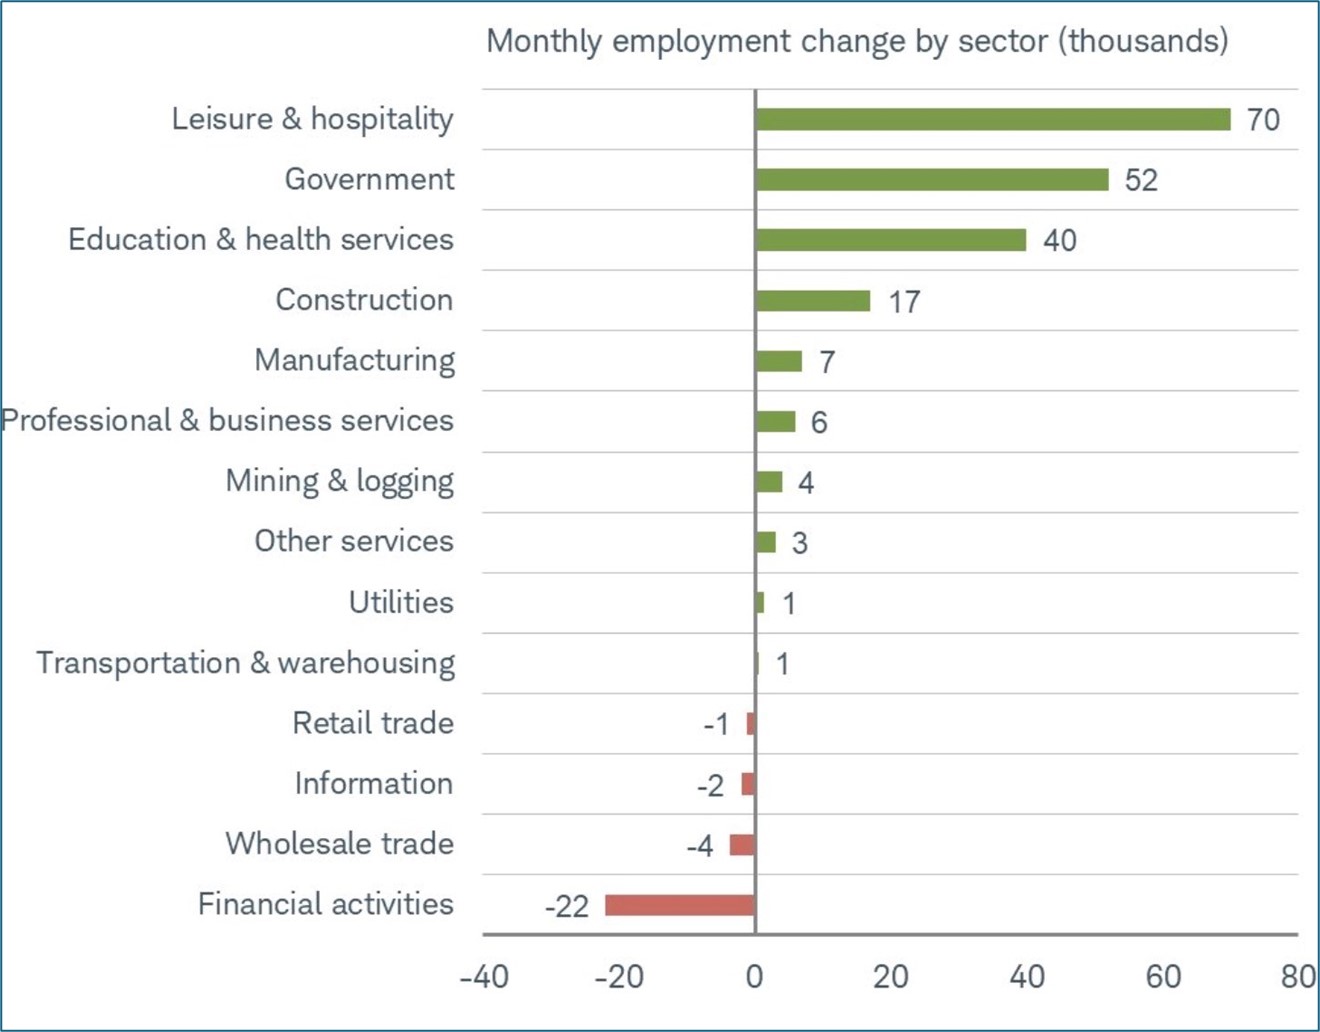
Source: BLS
Monthly Change in Nonfarm Payrolls – Over 150K for Third Straight Month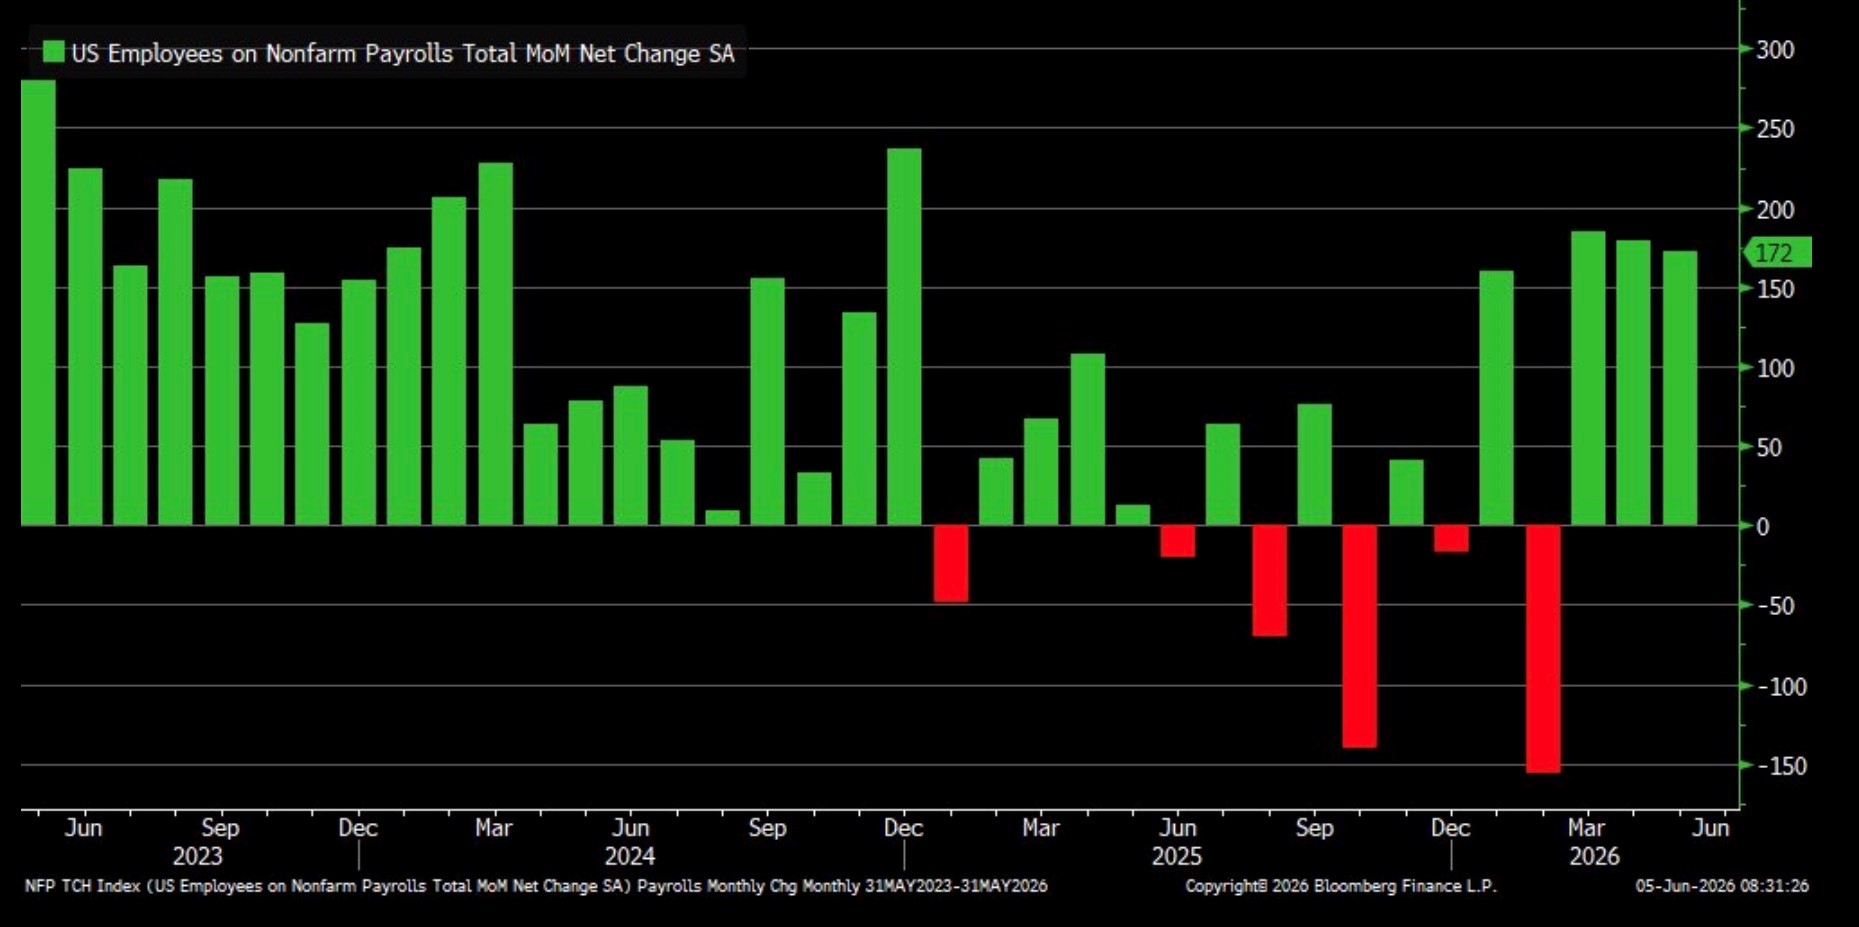
Source: BLS
May ISM Services Improved as News Orders Surged but Prices Paid Moved Higher Too 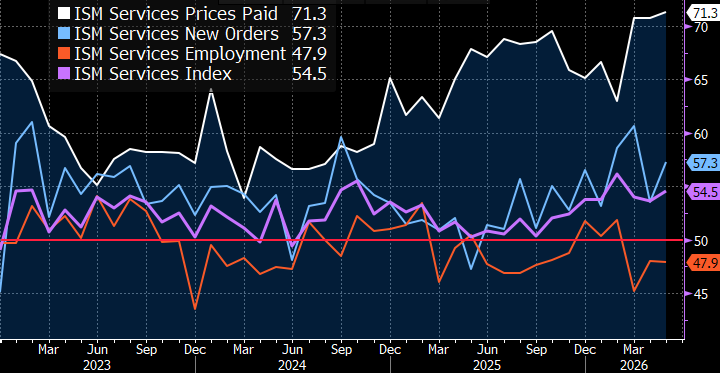 Source: ISM
Initial and Continuing Jobless Claims – Both Continue to Reflect the Low-Fire Environment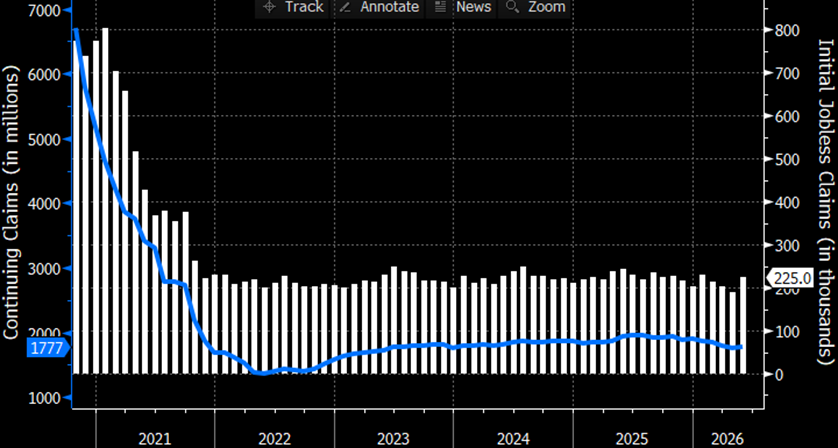 Source: Dept. of Labor
Securities offered through the SouthState | DuncanWilliams 1) are not FDIC insured, 2) not guaranteed by any bank, and 3) may lose value including a possible loss of principal invested. SouthState | DuncanWilliams does not provide legal or tax advice. Recipients should consult with their own legal or tax professionals prior to making any decision with a legal or tax consequence. The information contained in the summary was obtained from various sources that SouthState | DuncanWilliams believes to be reliable, but we do not guarantee its accuracy or completeness. The information contained in the summary speaks only to the dates shown and is subject to change with notice. This summary is for informational purposes only and is not intended to provide a recommendation with respect to any security. In addition, this summary does not take into account the financial position or investment objectives of any specific investor. This is not an offer to sell or buy any securities product, nor should it be construed as investment advice or investment recommendations.