
Subtle Signs of Slowing

- Yesterday brought a boatload of data points headlined by the Fed’s preferred inflation gauge. For the month, PCE was a bit cooler than expectations although yearly rates increased. The slightly cooler monthly prints on both headline and core, along with lower oil prices, provided a basis for Treasuries to rally which they held throughout the day. The new data also had some hints of economic slowing but it’s rather subtle at this point. Next week will bring plenty of May data headlined by the jobs report on Friday, so the navigation of new data is just beginning. Stay tuned! Currently, the 10yr is yielding 4.44%, down 1bp, while the 2yr is yielding 4.01%, down 2bps on the day.
- As we mentioned above, the Fed’s preferred inflation measure was released yesterday and it came in cooler than expected, at least on a monthly basis. The headline PCE price index rose 0.4% MoM vs. 0.5% expected and 0.7% in March. The YoY pace increased from 3.5% to 3.8%, matching forecasts. Core PCE — excluding food and energy — rose 0.2% MoM vs. 0.3% expected and March’s 0.3%. The YoY pace increased from 3.2% to 3.3%, matching forecasts. It was noted last week after the CPI, PPI and Import Price reports for April were released that the pieces feeding PCE were generally cooler than the headline prints and that fed the expectation of a more manageable increase in PCE inflation and that’s what we received in the report. Also, core services ex-housing – a key inflation metric of the Powell Fed – rose a modest 0.12%. However, the increase in annual inflation from March’s 3.5% headline reading keeps price pressures well above the Fed’s 2% target and that will keep the Fed firmly in wait and watch mode.
- The good news from the market’s perspective is that we didn’t see inflation from the energy complex spread into other areas to the degree it was picked up in the CPI/PPI/Import Price Reports that we saw last week. That gives investors hope that if a resolution is soon found to the Iran war, and an opening of the Strait of Hormuz, the energy price spike and bleed through to other goods and services may be limited. That, however, remains to be seen.
- On the income and spending numbers, personal income was essentially flat in April, declining less than $0.1 billion, while disposable personal income fell $19.9 billion (0.1%). Despite the softer income, consumer spending picked up with consumption rising 0.5%, which matched expectations but off from the 0.9% pace in March. Spending adjusted for inflation rose 0.1%, which also matched expectations but trailed the 0.2% pace in March.
- The spending was broad-based and included a few notable discretionary categories that indicate the mid-to-upper-tier income consumer continues to spend on items other than just daily essentials. Of the 16 separate categories, only three saw declines in monthly spending (clothing, financial services, and autos). Growth in spending was led by gas, housing/utilities, recreational services, and food services/accommodations. The drop in income came entirely from a decline in farm income following a halt to a subsidy program put in place to soften the tariff/trade impact; thus, the personal saving rate fell from 3.1% to 2.6%. Wages and other compensation, however, increased in line with previous months so we’re not going to make too much of the drop in income/savings rate in April. The savings rate has been coming down for months now, but consumers are turning more to credit card debt and home equity loans to fund consumption, and we suspect those will continue to be tapped until we see a major equity market correction that dents the wealth effect and psychology of the well-heeled shopper.
- The BEA’s second estimate for Q1 2026 GDP showed real growth of 1.6% annualized — a downward revision of 0.4 percentage point from the advance estimate of 2.0%, driven primarily by downward revisions to investment and consumer spending (1.4% vs. 1.6%). That’s still a significant improvement from Q4 2025’s meager 0.5% growth, but the downward revision will temper some of the optimism from last month’s initial reading. The report also showed real gross domestic income (GDI) grew just 0.9% in Q1, down from 1.6% in Q4, while corporate profits rose only $40.4 billion, a sharp deceleration from the $246.9 billion gain in Q4 2025. Looking at “core” spending, Real Final Sales to Private Domestic Purchasers, that metric slowed a tenth to 2.4% vs. 2.5% in the initial estimate, a still healthy core spending level. But make no doubt, the inflation uptick and moderating growth picture presents a challenging combination for the Fed heading into its June meeting.
- Also yesterday, the April Advance Durable Goods Report delivered what looked like a significant upside surprise. New orders for manufactured durable goods soared 7.9% — more than two times the 3.9% gain economists had forecast — following an upwardly revised 1.3% increase in March. The headline beat is a welcome contrast to the sluggish stretch that preceded it, as orders had declined in three of the four months before March’s rebound. The surge likely reflects a jump in transportation orders, but the more closely watched “core” figure stripping out transportation/aircraft rose 1.1%, matching the revised gain in March. Stripping out transportation and defense, orders decreased -1.1% vs. 3.9% in March. So, the strength noted in the headline number will be discounted to a degree as it came mostly from the volatile transportation and defense spending categories. Taken alongside the downward GDP revision and elevated PCE inflation, the net durable goods print adds to the tricky position the Fed is finding itself, an economy that is beginning to send faint signals of slowing with inflation still increasing.
- Finally, jobless claims are sending similar signals in the latest weekly report, with 215,000 Americans filing for unemployment benefits in the week ending May 23, up 5,000 from the prior week and above the 212,000 expectations. Continuing claims also increased, climbing 15 thousand to 1.786 million from 1.771 million. While slightly higher than the prior week, both figures remain low by historical standards and claims are still below year-ago levels, reinforcing the view that the labor market remains relatively resilient even as hiring momentum has cooled and broader economic uncertainty has increased.
Overall and Core PCE (YoY)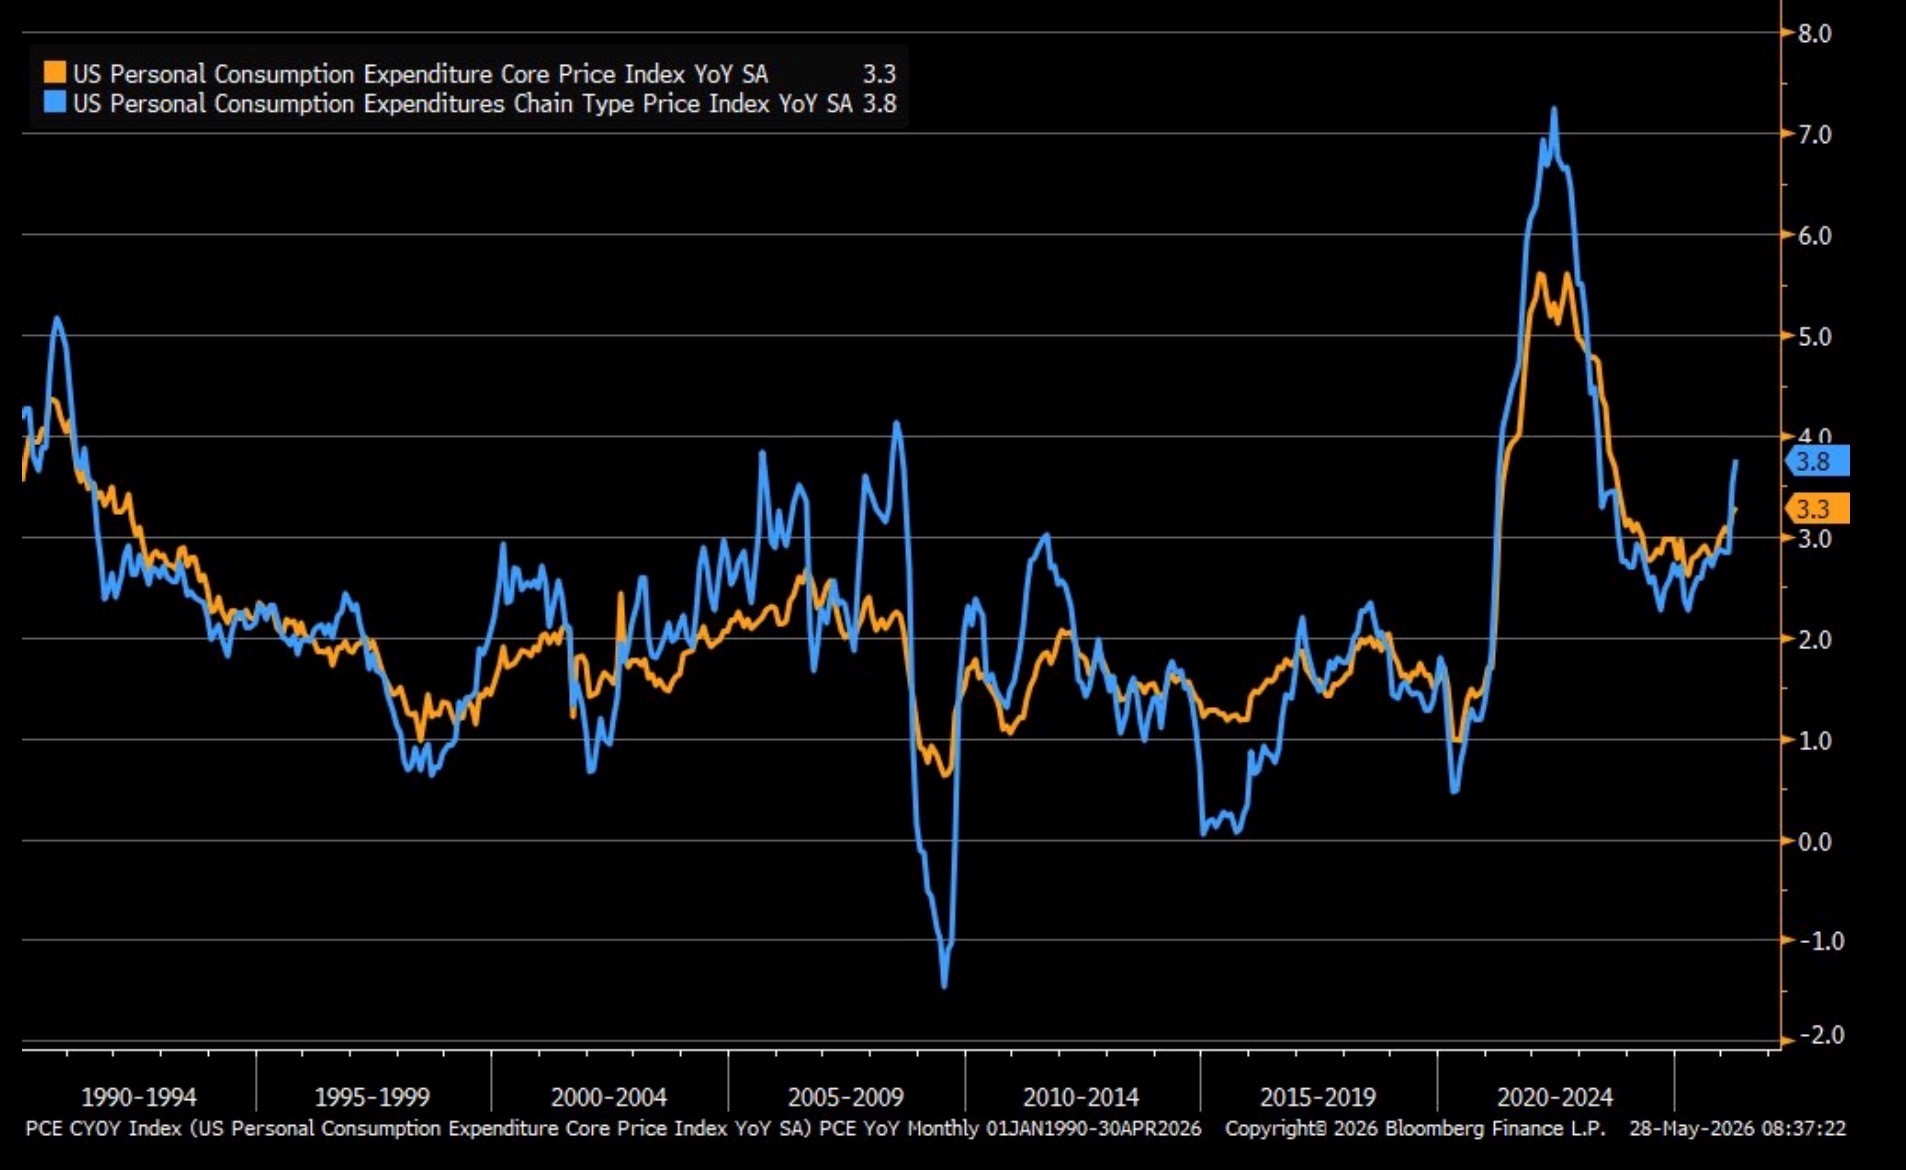
Source: BEA
Gas and Housing Led Gains in April Spending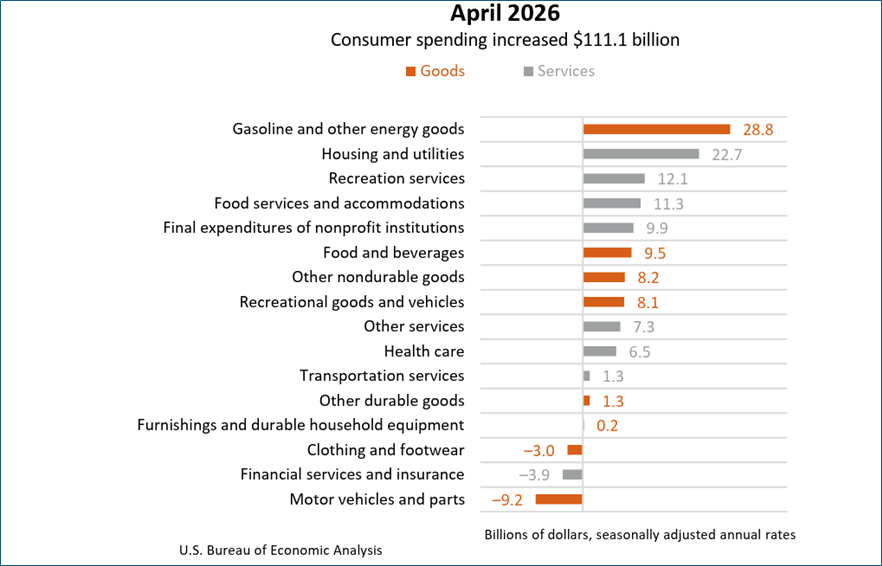
Personal Income and Spending (MoM) – Income Dropped due to Halting of Farm Subsidy Program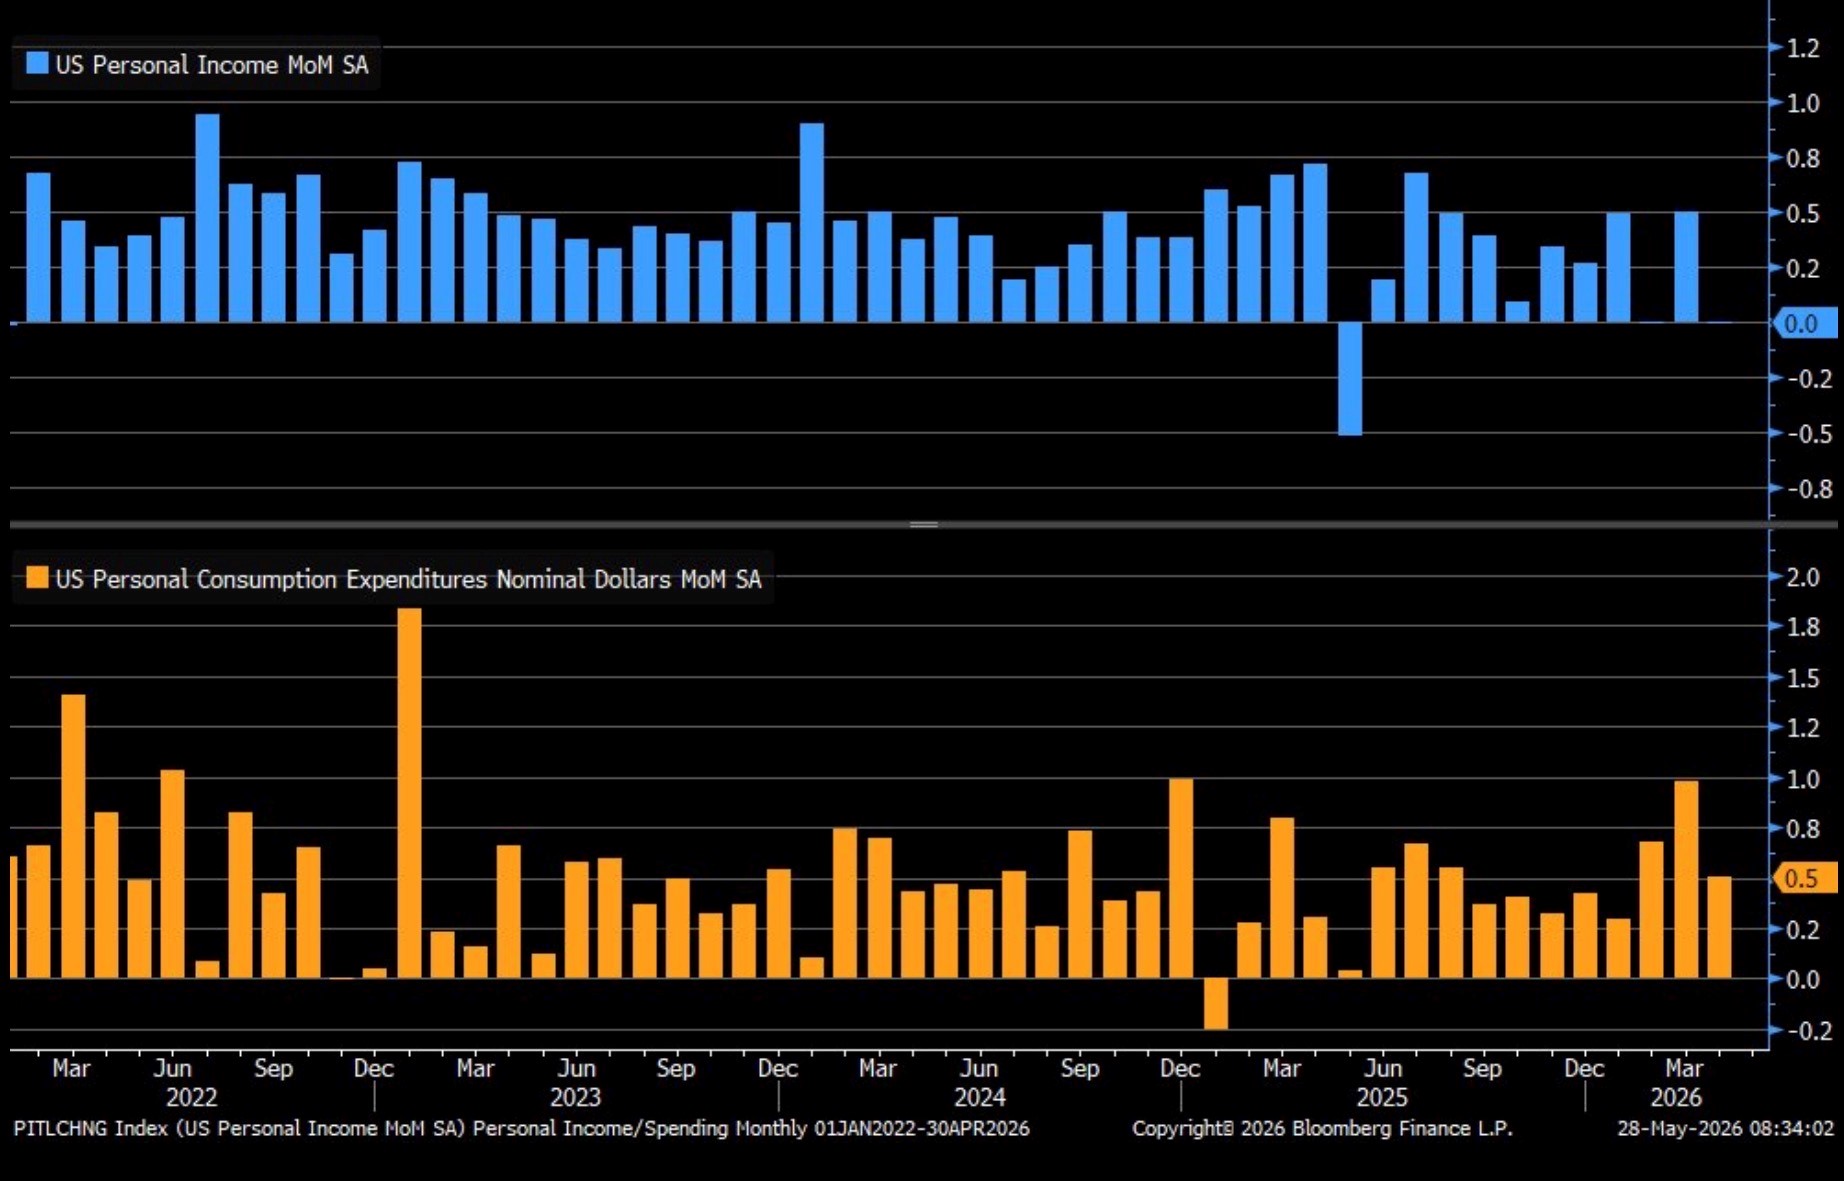
Source: BEA
Capital Goods Order Nondefense Ex-Air and Shipments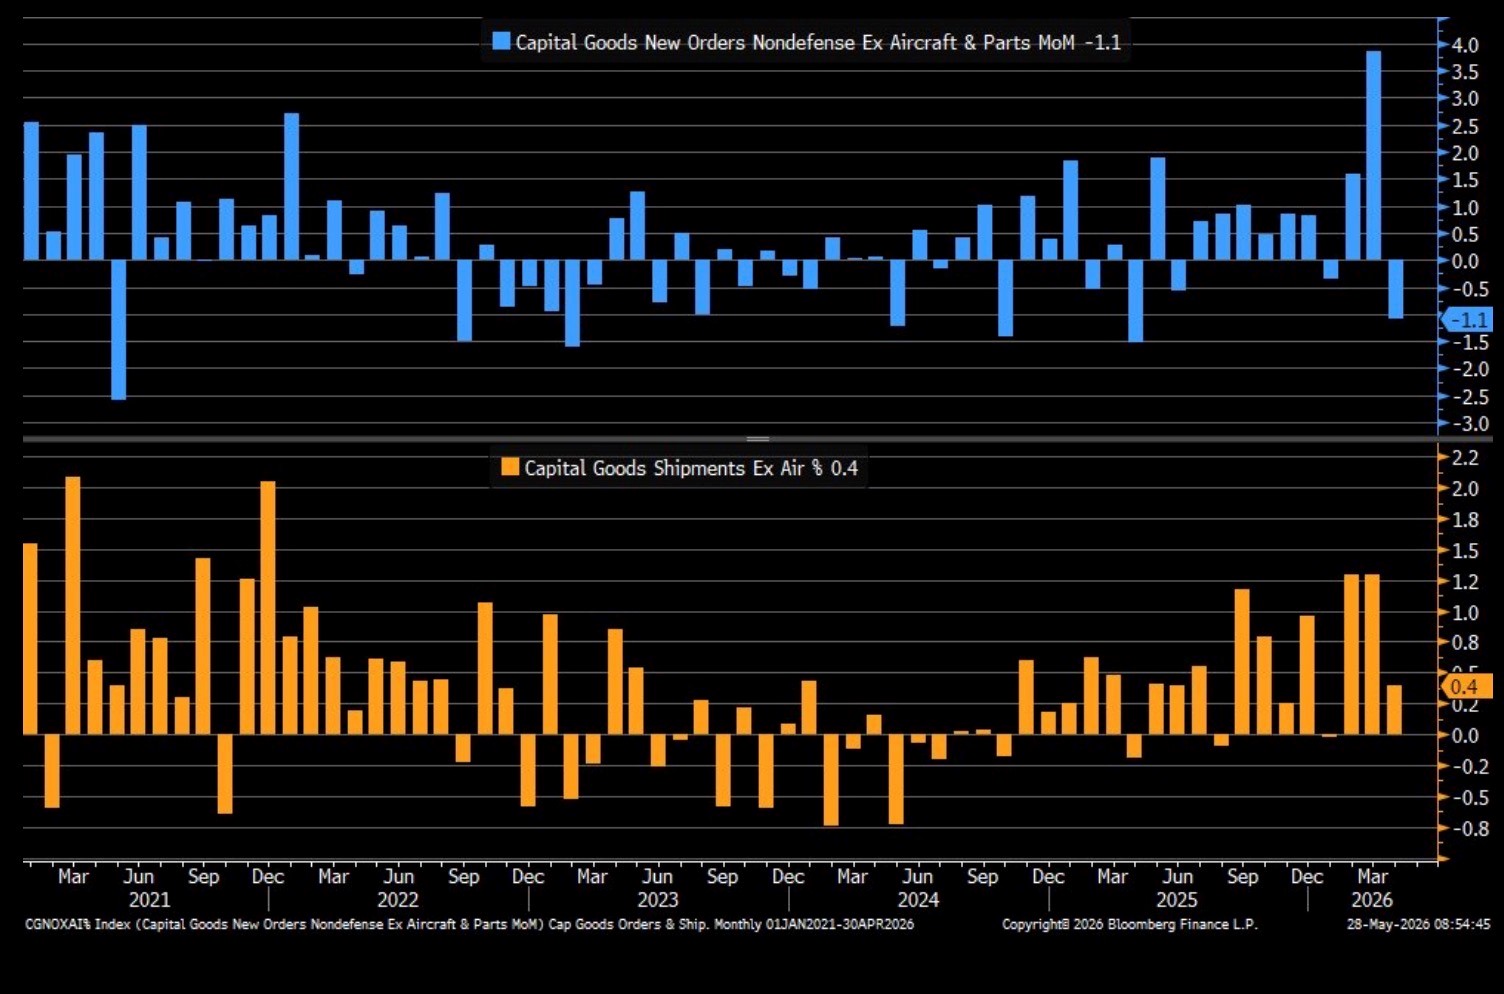
Source: US Census Bureau
Continuing Jobless Claims Slowly Climbing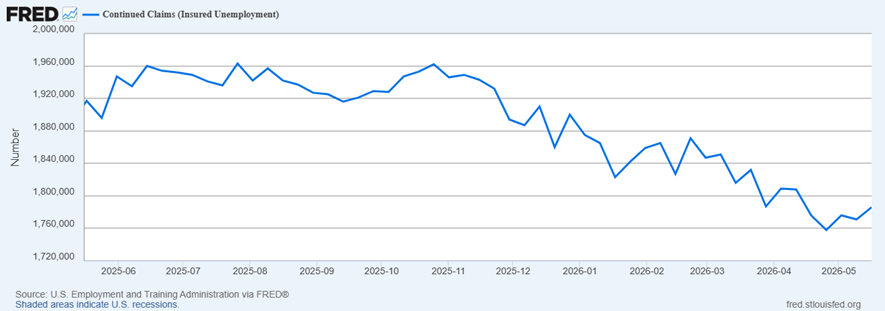
Securities offered through the SouthState | DuncanWilliams 1) are not FDIC insured, 2) not guaranteed by any bank, and 3) may lose value including a possible loss of principal invested. SouthState | DuncanWilliams does not provide legal or tax advice. Recipients should consult with their own legal or tax professionals prior to making any decision with a legal or tax consequence. The information contained in the summary was obtained from various sources that SouthState | DuncanWilliams believes to be reliable, but we do not guarantee its accuracy or completeness. The information contained in the summary speaks only to the dates shown and is subject to change with notice. This summary is for informational purposes only and is not intended to provide a recommendation with respect to any security. In addition, this summary does not take into account the financial position or investment objectives of any specific investor. This is not an offer to sell or buy any securities product, nor should it be construed as investment advice or investment recommendations.


